. 2009 Jun;35(3):306-28.
doi: 10.1111/j.1365-2990.2008.01006.x. Epub 2008 Dec 11.

Expression of the translocator protein of 18 kDa by microglia, macrophages and astrocytes based on immunohistochemical localization in abnormal human brain

Affiliations

Expression of the translocator protein of 18 kDa by microglia, macrophages and astrocytes based on immunohistochemical localization in abnormal human brain

M Cosenza-Nashat et al. Neuropathol Appl Neurobiol. 2009 Jun.

Abstract

Aims: Microglia are involved in neurodegeneration, are prime targets for anti-inflammatory therapy and are potential biomarkers of disease progression. For example, positron emission tomography imaging employing radioligands for the mitochondrial translocator protein of 18 kDa (TSPO, formerly known as the peripheral benzodiazepine receptor) is being scrutinized to detect neuroinflammation in various diseases. TSPO is presumably present in activated microglia, but may be present in other neural cells.

Methods: We sought to elucidate the protein expression in normal human central nervous system, several neurological diseases (HIV encephalitis, Alzheimer's disease, multiple sclerosis and stroke) and simian immunodeficiency virus encephalitis by performing immunohistochemistry with two anti-TSPO antibodies.

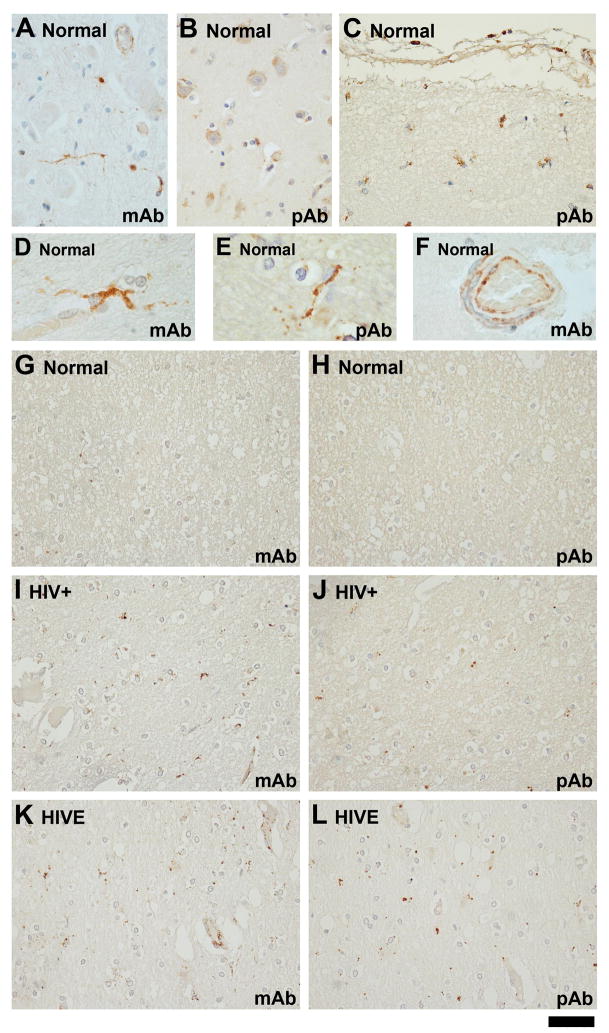
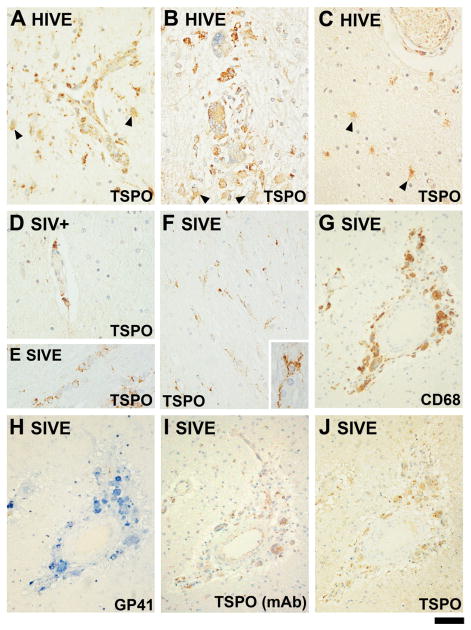
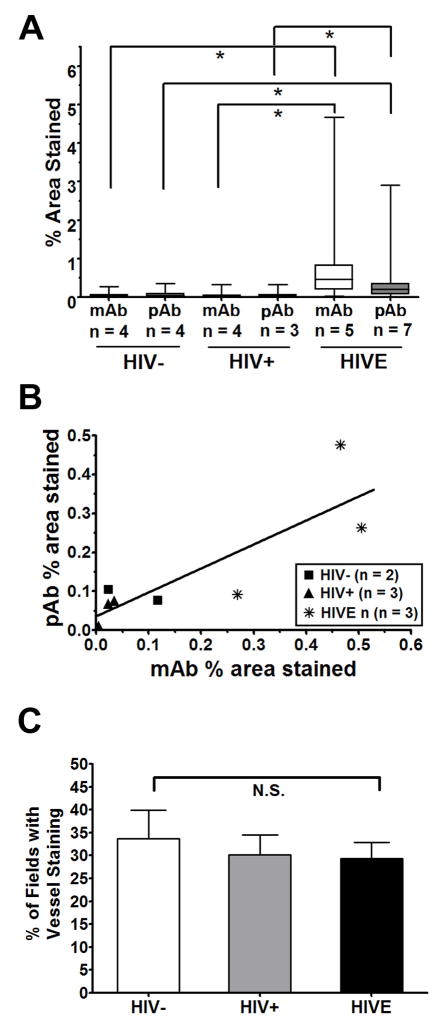
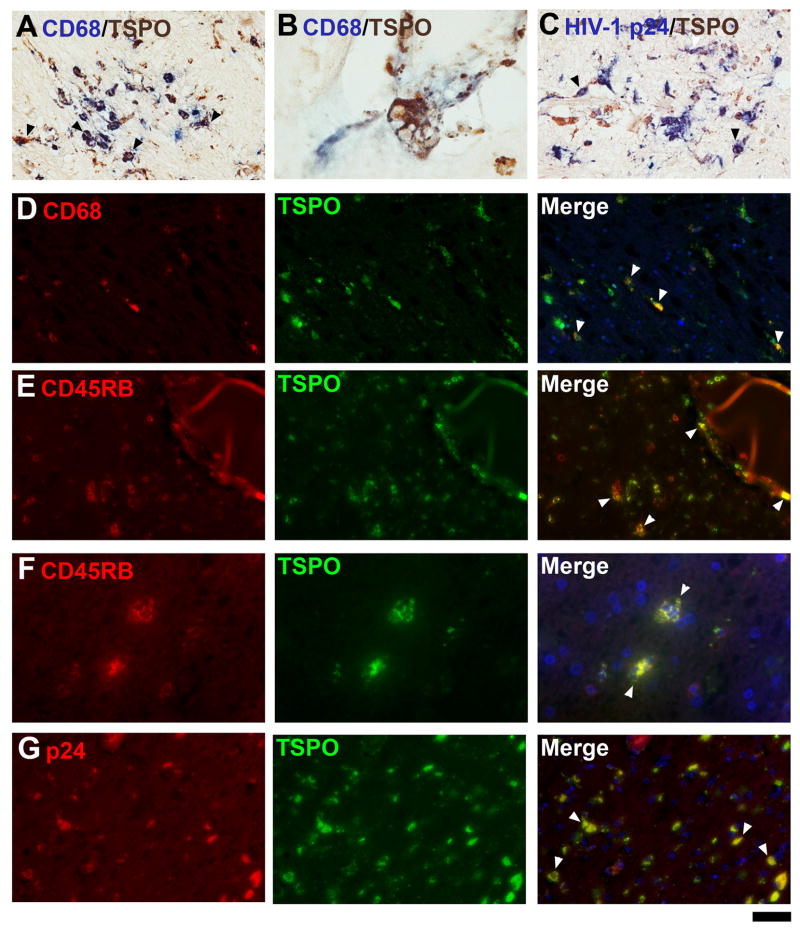
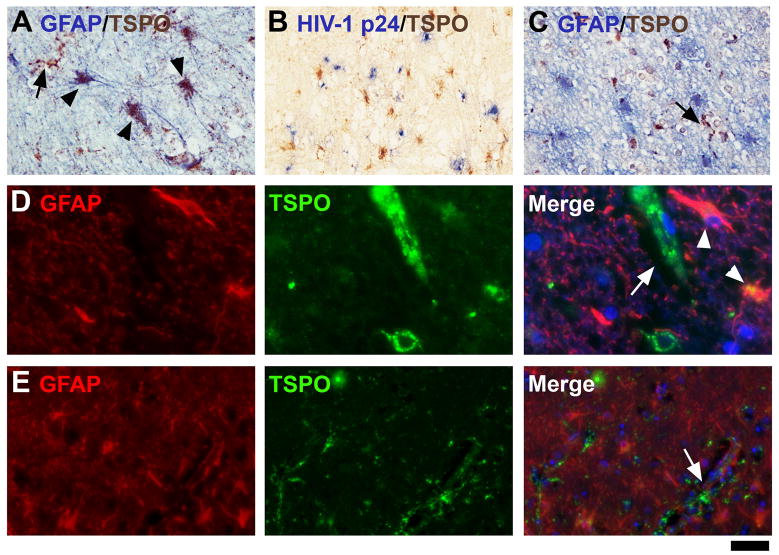
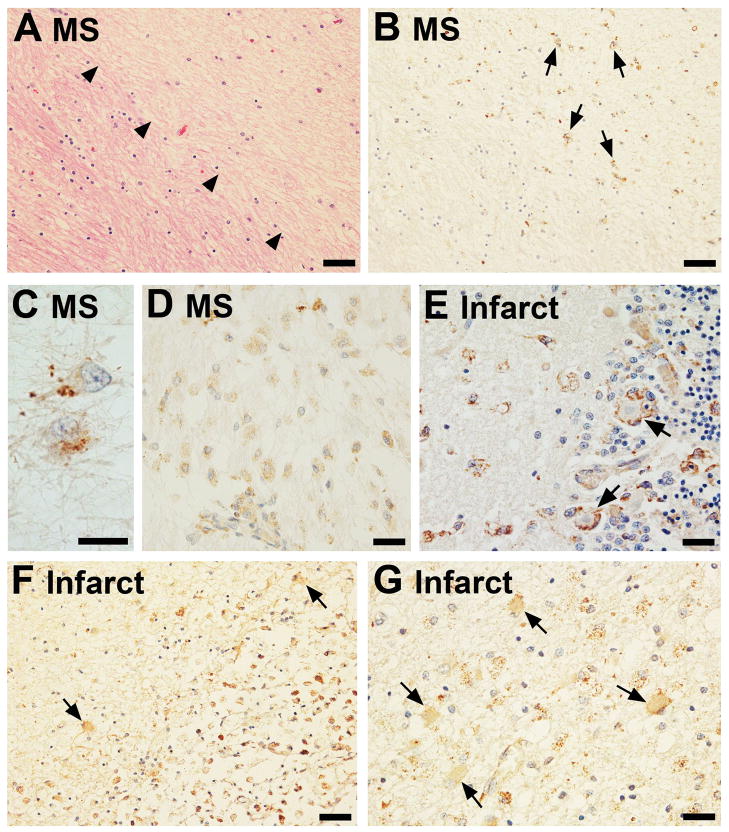
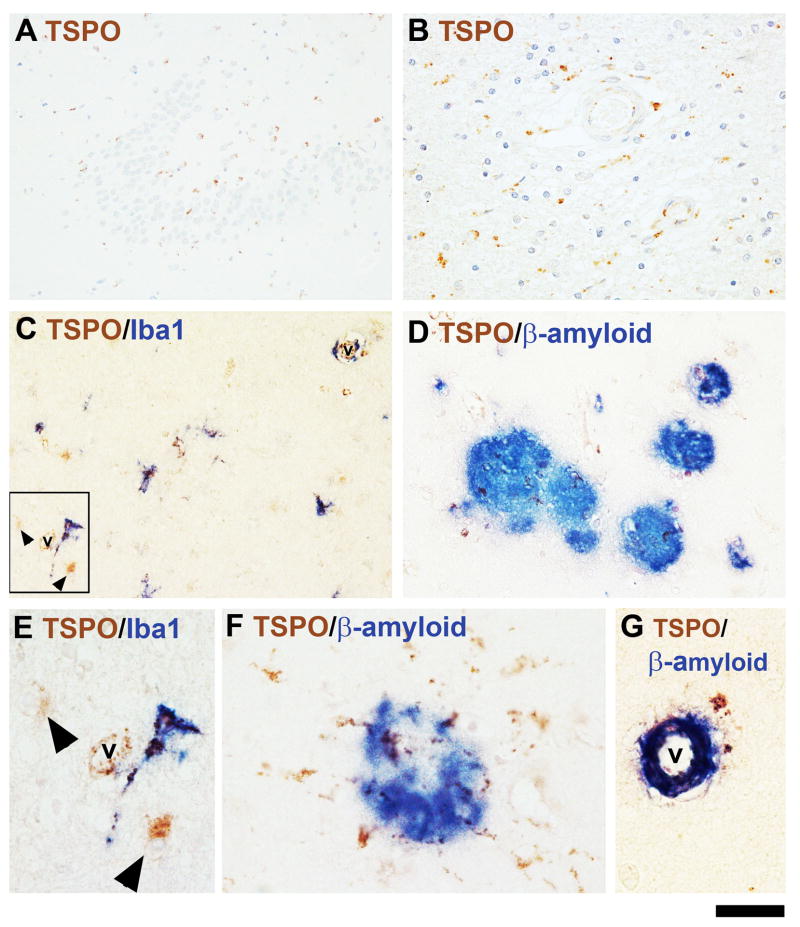
Results: Although the overall parenchymal staining was minimal in normal brain, endothelial and smooth muscle cells, subpial glia, intravascular monocytes and ependymal cells were TSPO-positive. In disease states, elevated TSPO was present in parenchymal microglia, macrophages and some hypertrophic astrocytes, but the distribution of TSPO varied depending on the disease, disease stage and proximity to the lesion or relation to infection. Staining with the two antibodies correlated well in white matter, but one antibody also stained cortical neurones. Quantitative analysis demonstrated a significant increase in TSPO in the white matter of HIV encephalitis compared with brains without encephalitis. TSPO expression was also increased in simian immunodeficiency virus encephalitis.

Conclusions: This report provides the first comprehensive immunohistochemical analysis of the expression of TSPO. The results are useful for informing the usage of positron emission tomography as an imaging modality and have an impact on the potential use of TSPO as an anti-inflammatory pharmacological target.


Figures

Figure 1
Figure 1. Comparison of monoclonal (mAb) and polyclonal (pAb) anti-TSPO antibodies in human CNS
Staining is present in both grey matter (A, B) and white matter (G, H) glial cells of normal human brain. The pAb has some staining of neurons (B), which is not observed with the mAb (A). The staining in normal brain is minimal, in general, although there is some case variation (see Figure 3, Table 3) and subpial glia (C) and ependymal cells (not shown) routinely express the TSPO. Under high power, most positively stained parenchymal cells have microglial morphology (D, E). Endothelial cell staining is more often observed with the mAb than with the pAb (F). Despite these differences, the two antibodies have good agreement with their staining in the white matter. The same normal case (G, H), HIV-seropositive case (I, J) and HIVE case (K, L) are stained with both antibodies as indicated. The scale bar represents 50 μm for A–C and G–L, but 20 μm in D–F.
Figure 2
Figure 2. Expression of TSPO in HIVE and in the SIV model in macaques
TSPO is shown in three cases of HIVE (A–C). The staining is with the pAb unless indicated otherwise. The microglial nodule shown in A is laden with TSPO+ perivascular cells and TSPO+ astrocytes are present. In all panels, TSPO+ astrocytes are indicated with arrowheads and cells were identified based on morphology. The microglial nodule shown in B is full of TSPO+ multinucleated giant cells. The area shown in (C), away from a microglial nodule, shows TSPO+ astrocytes adjacent to a vessel. (D) Perivascular TSPO+ cells are shown in an SIV+ brain without encephalitis. TSPO+ perivascular cells are also present in SIV− brain (not shown). (E) illustrates TSPO+ oligodendrocytes, based on the typical linear arrangement. (F) displays ramified microglia (based on morphology) observed throughout the parenchyma in one SIVE brain. One TSPO+ cell is shown in high power in the inset of (F). (G–J) are serial sections of the same microglial nodule stained for CD68: (G), SIV GP41 (H), the TSPO mAb (I) and the TSPO pAb (J). The scale bar represents 40 μm in A–F, 80μm in G–J and 12 μm in F inset.
Figure 3
Figure 3. Image analysis of TSPO immunohistochemistry for HIVE and controls
Image analysis of TSPO was completed for twenty 400X microscope fields of white matter per case for each antibody. (A) Staining is expressed as the percent area stained as analyzed with NIH ImageJ, as described in the Methods. The data are represented as the median ± range with the box indicating the 25th and 75th quartiles. The average percent area stained for sections immunolabeled with the monoclonal antibody (mAb, white boxes) and sections labeled with the polyclonal antibody (pAb, grey boxes) are shown. Asterisks denote p <0.001 by Kruskal-Wallis analysis of variance followed by Dunn’s multiple comparison test. (B) For cases where serial sections from the same case were available for both the mAb and the pAb (total n = 8), a Spearman correlation analysis was performed which indicated a significant correlation (p < 0.05; r = 0.83). (C) Sections stained with the mAb were analyzed for vessel staining as described in the Methods. The percent of fields where vessel staining was evident was not significantly different between HIV−, HIV+ and HIVE based on one-way analysis of variance (p > 0.05). N.S. = not significant.
Figure 4
Figure 4. Double-immunohistochemistry for TSPO and microglial markers in HIVE
In HIVE, the majority of TSPO-expressing cells are microglia, as shown with CD68 labeling (A, B, D panels) and CD45RB (E and F panels). Multinucleated giant cells are double labeled (B). HIV-infected cells express TSPO as seen in microglial nodules stained for HIV-1 p24 (C, G panels). Arrowheads illustrate some cells double-labeled for both markers. The scale bar represent 30 μm in A, C and 12μm in B, 50 μm in D, E and G and 25 μm in F.
Figure 5
Figure 5. TSPO in astrocytes in HIVE
All cases of HIVE displayed some degree of astrocytic expression. One case with relatively high astrocytic expression of the TSPO is shown with double-label IHC for GFAP (A, D panels). The same case is stained for TSPO with HIV-1 p24 (B). Two other cases with less astrocytic staining are shown (C, E panels). Note that GFAP+ astrocytes are not double-labeled in these cases. Double-labeled astrocytes are indicated with arrowheads, while TSPO-expressing microglia (GFAP) are indicated with arrows. The scale bar represents 30 μm in A and C, 60 μm in B, 12.5 μm in D and 50 μm in E.
Figure 6
Figure 6. TSPO expression in multiple sclerosis (MS) and ischemic stroke
An area of demyelination is demarcated by arrowheads in an MS brain (H&E, A) and the same region of this plaque shows high TSPO labeling in the demyelinated area (arrows, B) as imaged from a serial section of the same block. TSPO+ cells in the old plaque are most likely fibrillary astrocytes (shown in high power in C). In an active plaque, TSPO+ amoeboid macrophages are prominent (D). Transforming microglia around Purkinje cells display strong TSPO positivity and are observed in a sub-acute infarct (E). TSPO+ cells can be observed juxtaposed to the neurons (arrows, E). Bordering a chronic infarct were TSPO+ cells with astrocytic morphology (arrows, F, G), as well as amoeboid cells. The scale bars represent 50 μm in A, B and F; 25 μm in D,E and G; and 15 μm in C.
Figure 7
Figure 7. TSPO expression in Alzheimer’s disease (AD)
TSPO is present in glial cells sprinkled throughout the dentate gyrus and the adjacent areas (A) as well as in the hippocampal white matter (B). Glial cells expressing TSPO included Iba1+ microglial cells (C, E) as well as Iba1-negative cells, with astroglial morphology (arrows, C, E). The region in E is a high power image of the boxed region in (C). Note the dark spots within the cytoplasm (TSPO stain) of the Iba1+ ramified cell and the swollen nuclei of the astrocyte-like cells in E. TSPO+ cells were also found associating with senile plaques. Aβ+ plaques of various sizes are shown in (D) and TSPO+ glial cells radiate from one plaque (F, high power). A vessel with amyloid angiopathy was also TSPO+ (G). The scale bar represents 100 μm in A; 50 μm in B, C and D; and 20 μm in E, F and G. v = vessel lumen.

References

    1. Hanisch UK, Kettenmann H. Microglia: active sensor and versatile effector cells in the normal and pathologic brain. Nat Neurosci. 2007;10:1387–1394. - PubMed
    1. Glezer I, Simard AR, Rivest S. Neuroprotective role of the innate immune system by microglia. Neuroscience. 2007;147:867–883. - PubMed
    1. Garden GA, Moller T. Microglia biology in health and disease. J Neuroimmune Pharmacol. 2006;1:127–137. - PubMed
    1. Biber K, Neumann H, Inoue K, Boddeke HW. Neuronal ‘On’ and ‘Off’ signals control microglia. Trends Neurosci. 2007;30:596–602. - PubMed
    1. Lee SC, Cosenza MA, Si Q, Rivieccio M, Brosnan CF. The CNS: Cells, Tissues, and Reactions to Insult. In: Ransohoff RM, Benveniste EN, editors. Cytokines and the CNS. 2. Boca Raton, FL: Taylor & Francis Group; 2006. pp. 1–22.

Publication types

MeSH terms