

Analysis of chromatin boundary activity in Drosophila cells
- PMID: 19077248
- PMCID: PMC2621236
- DOI: 10.1186/1471-2199-9-109
Analysis of chromatin boundary activity in Drosophila cells
Abstract
Background: Chromatin boundaries, also known as insulators, regulate gene activity by organizing active and repressive chromatin domains and modulate enhancer-promoter interactions. However, the mechanisms of boundary action are poorly understood, in part due to our limited knowledge about insulator proteins, and a shortage of standard assays by which diverse boundaries could be compared.
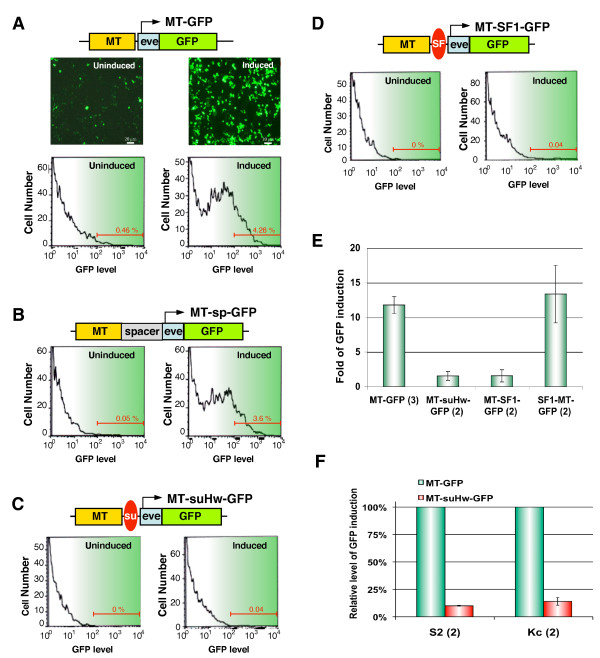
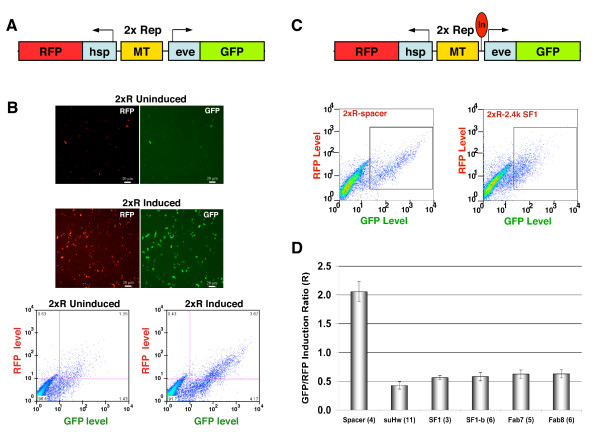
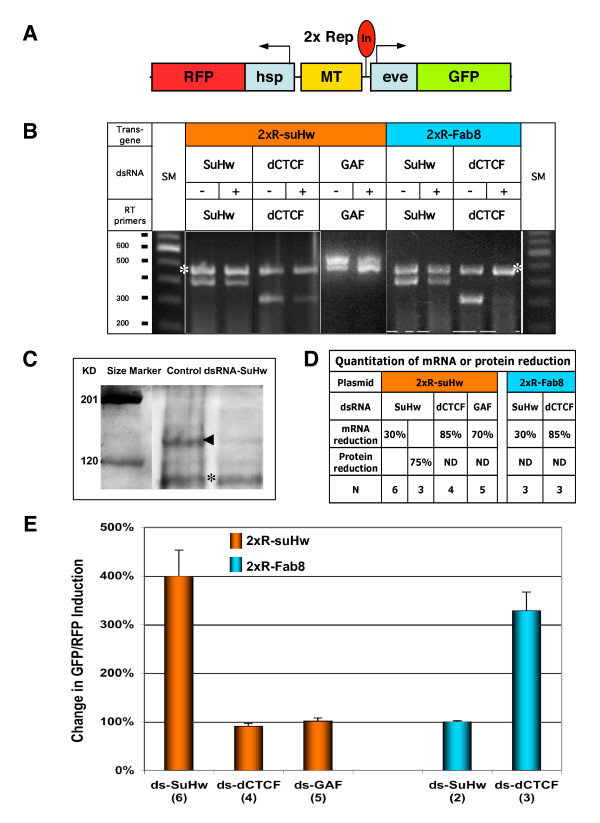
Results: We report here the development of an enhancer-blocking assay for studying insulator activity in Drosophila cultured cells. We show that the activities of diverse Drosophila insulators including suHw, SF1, SF1b, Fab7 and Fab8 are supported in these cells. We further show that double stranded RNA (dsRNA)-mediated knockdown of SuHw and dCTCF factors disrupts the enhancer-blocking function of suHw and Fab8, respectively, thereby establishing the effectiveness of using RNA interference in our cell-based assay for probing insulator function.
Conclusion: The novel boundary assay provides a quantitative and efficient method for analyzing insulator mechanism and can be further exploited in genome-wide RNAi screens for insulator components. It provides a useful tool that complements the transgenic and genetic approaches for studying this important class of regulatory elements.
Figures

Similar articles
-
The functional analysis of insulator interactions in the Drosophila embryo.Proc Natl Acad Sci U S A. 2003 Apr 29;100(9):5223-8. doi: 10.1073/pnas.0830190100. Epub 2003 Apr 16. Proc Natl Acad Sci U S A. 2003. PMID: 12700350 Free PMC article.
-
Drosophila CP190- and dCTCF-mediated enhancer blocking is augmented by SUMOylation.Epigenetics Chromatin. 2017 Jul 4;10:32. doi: 10.1186/s13072-017-0140-6. eCollection 2017. Epigenetics Chromatin. 2017. PMID: 28680483 Free PMC article.
-
Effects of cis arrangement of chromatin insulators on enhancer-blocking activity.Science. 2001 Jan 19;291(5503):493-5. doi: 10.1126/science.291.5503.493. Science. 2001. PMID: 11161205
-
Chromatin insulators and long-distance interactions in Drosophila.FEBS Lett. 2014 Jan 3;588(1):8-14. doi: 10.1016/j.febslet.2013.10.039. Epub 2013 Nov 5. FEBS Lett. 2014. PMID: 24211836 Review.
-
Genetic and molecular analysis of the gypsy chromatin insulator of Drosophila.Proc Natl Acad Sci U S A. 1996 Sep 3;93(18):9378-83. doi: 10.1073/pnas.93.18.9378. Proc Natl Acad Sci U S A. 1996. PMID: 8790337 Free PMC article. Review.
Cited by
-
Conserved boundary elements from the Hox complex of mosquito, Anopheles gambiae.Nucleic Acids Res. 2013 Jan;41(2):804-16. doi: 10.1093/nar/gks1178. Epub 2012 Dec 4. Nucleic Acids Res. 2013. PMID: 23221647 Free PMC article.
-
A Cell Density-Dependent Reporter in the Drosophila S2 Cells.Sci Rep. 2019 Aug 14;9(1):11868. doi: 10.1038/s41598-019-47652-0. Sci Rep. 2019. PMID: 31413273 Free PMC article.
-
NURF301 contributes to gypsy chromatin insulator-mediated nuclear organization.Nucleic Acids Res. 2022 Aug 12;50(14):7906-7924. doi: 10.1093/nar/gkac600. Nucleic Acids Res. 2022. PMID: 35819192 Free PMC article.
-
Interdependence of PRC1 and PRC2 for recruitment to Polycomb Response Elements.Nucleic Acids Res. 2016 Dec 1;44(21):10132-10149. doi: 10.1093/nar/gkw701. Epub 2016 Aug 23. Nucleic Acids Res. 2016. PMID: 27557709 Free PMC article.
-
Modulation of chromatin boundary activities by nucleosome-remodeling activities in Drosophila melanogaster.Mol Cell Biol. 2010 Feb;30(4):1067-76. doi: 10.1128/MCB.00183-09. Epub 2009 Dec 7. Mol Cell Biol. 2010. PMID: 19995906 Free PMC article.
References
-
- Celniker SE, Drewell RA. Chromatin looping mediates boundary element promoter interactions. Bioessays. 2007;29:7–10. - PubMed
-
- Wei GH, Liu de P, Liang CC. Chromatin domain boundaries: insulators and beyond. Cell Res. 2005;15:292–300. - PubMed
-
- Cai HN. Function and mechanism of chromatin boundaries. In: Ma J, editor. Gene Expression and Regulation. Beijing: Higher Education Press; 2006.
-
- Sipos L, Gyurkovics H. Long-distance interactions between enhancers and promoters. Febs J. 2005;272:3253–3259. - PubMed
Publication types
MeSH terms
Substances
Grants and funding
LinkOut - more resources
Full Text Sources
Molecular Biology Databases
