

Fr-TM-align: a new protein structural alignment method based on fragment alignments and the TM-score
- PMID: 19077267
- PMCID: PMC2628391
- DOI: 10.1186/1471-2105-9-531
Fr-TM-align: a new protein structural alignment method based on fragment alignments and the TM-score
Abstract
Background: Protein tertiary structure comparisons are employed in various fields of contemporary structural biology. Most structure comparison methods involve generation of an initial seed alignment, which is extended and/or refined to provide the best structural superposition between a pair of protein structures as assessed by a structure comparison metric. One such metric, the TM-score, was recently introduced to provide a combined structure quality measure of the coordinate root mean square deviation between a pair of structures and coverage. Using the TM-score, the TM-align structure alignment algorithm was developed that was often found to have better accuracy and coverage than the most commonly used structural alignment programs; however, there were a number of situations when this was not true.
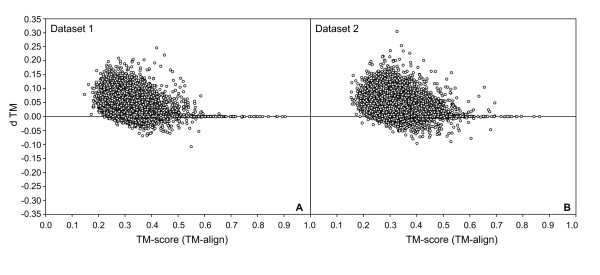
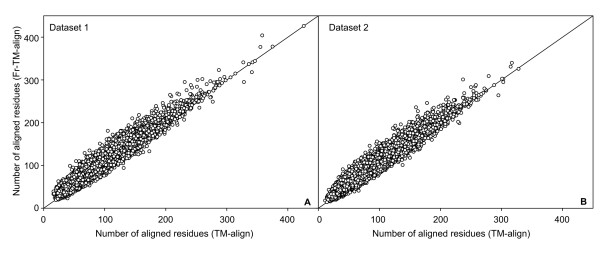
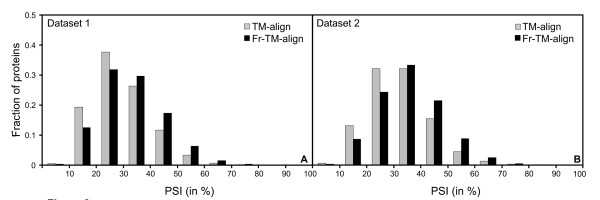
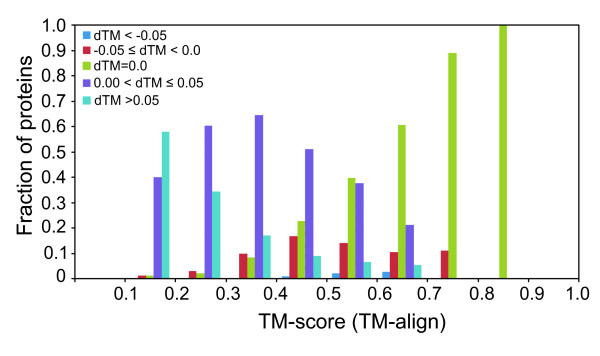
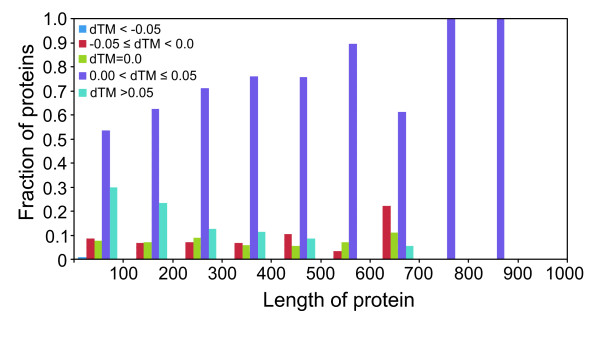
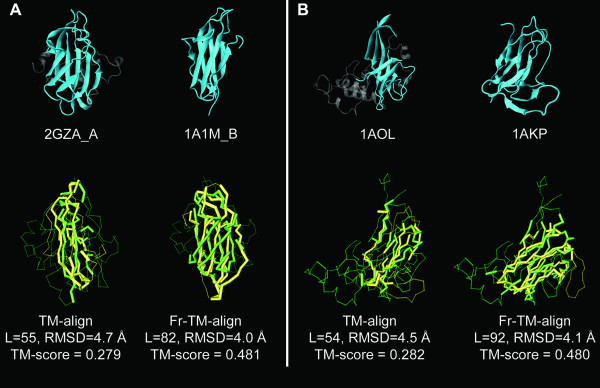
Results: To further improve structure alignment quality, the Fr-TM-align algorithm has been developed where aligned fragment pairs are used to generate the initial seed alignments that are then refined using dynamic programming to maximize the TM-score. For the assessment of the structural alignment quality from Fr-TM-align in comparison to other programs such as CE and TM-align, we examined various alignment quality assessment scores such as PSI and TM-score. The assessment showed that the structural alignment quality from Fr-TM-align is better in comparison to both CE and TM-align. On average, the structural alignments generated using Fr-TM-align have a higher TM-score (~9%) and coverage (~7%) in comparison to those generated by TM-align. Fr-TM-align uses an exhaustive procedure to generate initial seed alignments. Hence, the algorithm is computationally more expensive than TM-align.
Conclusion: Fr-TM-align, a new algorithm that employs fragment alignment and assembly provides better structural alignments in comparison to TM-align. The source code and executables of Fr-TM-align are freely downloadable at: http://cssb.biology.gatech.edu/skolnick/files/FrTMalign/.
Figures
References
-
- Murzin AG, Brenner SE, Hubbard T, Chothia C. SCOP: a structural classification of proteins database for the investigation of sequences and structures. J Mol Biol. 1995;247:536–540. - PubMed
-
- Orengo CA, Michie AD, Jones S, Jones DT, Swindells MB, Thornton JM. CATH–a hierarchic classification of protein domain structures. Structure. 1997;5:1093–1108. - PubMed
-
- Moult J, Fidelis K, Zemla A, Hubbard T. Critical assessment of methods of protein structure prediction (CASP)-round V. Proteins. 2003;53:334–339. - PubMed
-
- Sanchez R, Sali A. Evaluation of comparative protein structure modeling by MODELLER-3. Proteins. 1997:50–58. - PubMed
Publication types
MeSH terms
Substances
Grants and funding
LinkOut - more resources
Full Text Sources
Other Literature Sources
