

GPAT: retrieval of genomic annotation from large genomic position datasets
- PMID: 19077303
- PMCID: PMC2654044
- DOI: 10.1186/1471-2105-9-533
GPAT: retrieval of genomic annotation from large genomic position datasets
Abstract
Background: Recent genome wide transcription factor binding site or chromatin modification mapping analysis techniques, such as chromatin immunoprecipitation (ChIP) linked to DNA microarray analysis (ChIP on chip) or ChIP coupled to high throughput sequencing (ChIP-seq), generate tremendous amounts of genomic location data in the form of one-dimensional series of signals. After pre-analysis of these data (signal pre-clearing, relevant binding site detection), biologists need to search for the biological relevance of the detected genomic positions representing transcription regulation or chromatin modification events.
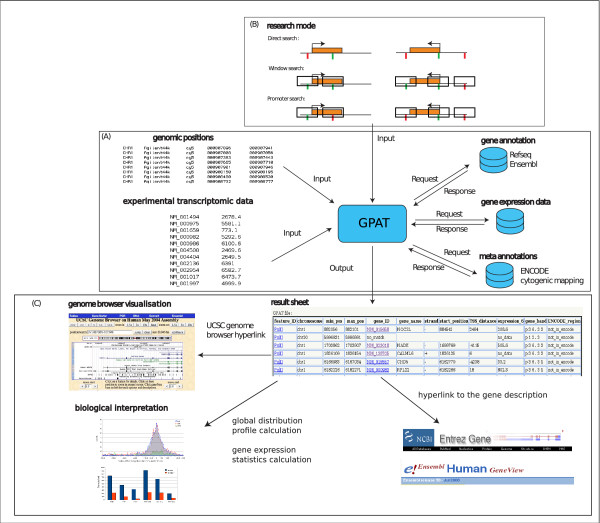
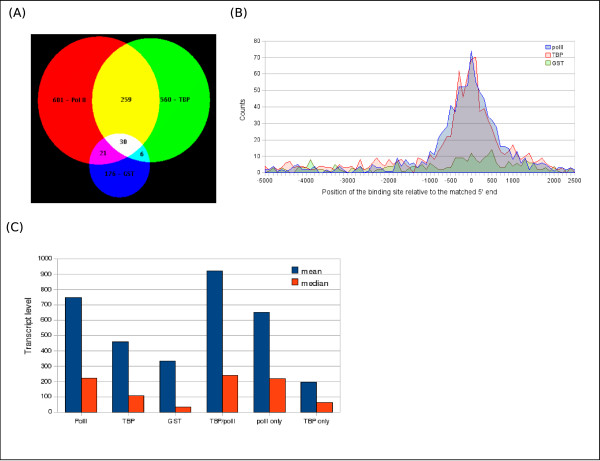
Results: To address this problem, we have developed a Genomic Position Annotation Tool (GPAT) with a simple web interface that allows the rapid and systematic labelling of thousands of genomic positions with several types of annotations. GPAT automatically extracts gene annotation information around the submitted positions from different public databases (Refseq or ENSEMBL). In addition, GPAT provides access to the expression status of the corresponding genes from either existing transcriptomic databases or from user generated expression data sets. Furthermore, GPAT allows the localisation of the genomic coordinates relative to the chromosome bands and the well characterised ENCODE regions. We successfully used GPAT to analyse ChIP on chip data and to identify genes functionally regulated by the TATA binding protein (TBP).
Conclusion: GPAT provides a quick, convenient and flexible way to annotate large sets of genomic positions obtained after pre-analysis of ChIP-chip, ChIP-seq or other high throughput sequencing-based techniques. Through the different annotation data displayed, GPAT facilitates the interpretation of genome wide datasets for molecular biologists.
Figures
References
-
- Mpeak software http://www.stat.ucla.edu/~zmdl/mpeak
-
- Python (v2.5.1) http://www.python.org
-
- Apache http://www.apache.org
-
- PostgreSQL http://www.postgresql.org
-
- PygreSQL http://www.druid.net/pygresql
Publication types
MeSH terms
LinkOut - more resources
Full Text Sources
