. 2009 Feb 4;28(3):193-204.
doi: 10.1038/emboj.2008.264. Epub 2008 Dec 11.

RodZ (YfgA) is required for proper assembly of the MreB actin cytoskeleton and cell shape in E. coli

Affiliations

RodZ (YfgA) is required for proper assembly of the MreB actin cytoskeleton and cell shape in E. coli

Felipe O Bendezú et al. EMBO J. .

Abstract

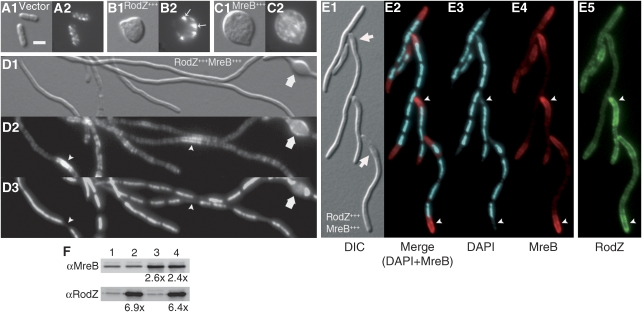
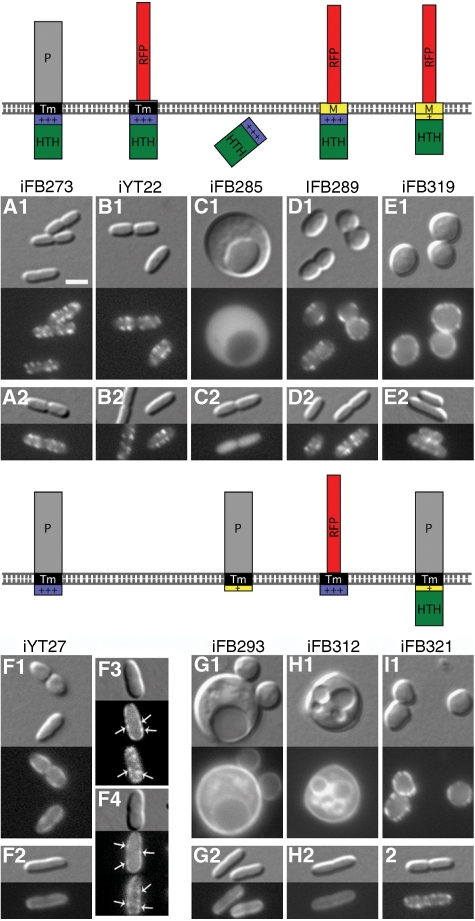
The bacterial MreB actin cytoskeleton is required for cell shape maintenance in most non-spherical organisms. In rod-shaped cells such as Escherichia coli, it typically assembles along the long axis in a spiral-like configuration just underneath the cytoplasmic membrane. How this configuration is controlled and how it helps dictate cell shape is unclear. In a new genetic screen for cell shape mutants, we identified RodZ (YfgA) as an important transmembrane component of the cytoskeleton. Loss of RodZ leads to misassembly of MreB into non-spiral structures, and a consequent loss of cell shape. A juxta-membrane domain of RodZ is essential to maintain rod shape, whereas other domains on either side of the membrane have critical, but partially redundant, functions. Though one of these domains resembles a DNA-binding motif, our evidence indicates that it is primarily responsible for association of RodZ with the cytoskeleton.


Figures

Figure 1
Figure 1
The E. coli rodZ locus and predicted RodZ domain structure. (A) Insertion sites of the rod2352 EZ::Tn transposon (open triangle) and of transposons previously recovered in rodZ (Gerdes et al, 2003) (black triangles), the positions of chromosomal deletion replacements and corresponding strain designations, inserts in plasmids used for initial complementation assays (thick lines), and the results of these assays. Portions of the chromosome that were replaced with an aph cassette, an frt scar sequence or a heterologous transcription regulatory cassette (aph araC PBAD) are indicated by brackets and adjacent numbers refer to base pairs replaced, counting from the start of rodZ. A translation stop (TAA) was placed immediately following codon 155 of rodZ in strain FB61. Plasmids carried the indicated inserts downstream of the lac regulatory region. +, capable of correcting RodZ and/or IspG phenotypes; −, incapable of correcting phenotype; ND, not done. (B) Predicted domain organization of RodZ. HTH, Cro/CI-type helix-turn-helix motif (green); +++, basic juxta-membrane (JM) domain (purple); TM, transmembrane domain (black); periplasmic (P) domain (grey) with a region rich in prolines and threonines followed by one that may form several β strands. (C) Comparison of the cytoplasmic portion of RodZ with the N terminus of λ repressor. Basic residues are in blue and acidic ones in red. Helices 1–5 of λCI, and corresponding predicted helices in RodZ are boxed. Identical (*) and similar (.) residues are indicated. The JM domain (residues 85–111) is underlined.
Figure 2
Figure 2
Growth and shape phenotypes of ΔrodZ cells, and correction by GFP–RodZ. (A) Spot-titre analyses of wt and ΔrodZ cells. Strains FB60 [ΔrodZ] (uneven rows) and its parent TB28 [wt] (even rows) were grown to density overnight (ON) in M9-mal at 37°C. Cultures were diluted in the same to an optical density at 600 nm (OD600) of 2.4 × 10⁻² (columns A and E), 10−3 (columns B and F), 10−4 (columns C and G) and 10−5 (columns D and H), and 10 μl aliquots were spotted on M9-mal (left panel) and LB (right panel) agar. The plates were incubated for 24 (LB) or 48 (M9) h at the indicated temperatures. (B) Phenotypes of wt and ΔrodZ cells. Aliquots of the ON cultures used in (A) were diluted to OD600=0.01 in M9-mal or LB and grown to OD600=0.1–0.3 at the indicated temperatures. Cells were fixed and imaged by DIC microscopy. (C) Suppression of ΔrodZ-associated lethality by extra FtsZ. ON cultures of TB28/pDR3 [wt/Plac::ftsZ] (even rows) and FB60/pDR3 [ΔrodZ /Plac::ftsZ] (uneven rows), grown in LB with 50 μM IPTG, were diluted 104 (columns A and D), 105 (columns B and E) and 106 (columns C and F) times in LB, and 10-μl aliquots were spotted on LB plates containing no (columns A–C) or 50 μM (columns D–F) IPTG. (D) Phenotype of ΔrodZ cells producing extra FtsZ. FB60/pDR3 [ΔrodZ/Plac::ftsZ] cells were grown at 30°C in LB with 50 μM IPTG to OD600=0.3. Note the branching, bulges and oddly placed constrictions. (E) Spiral-like localization of functional GFP–RodZ. FB60(iFB273) [ΔrodZ (Plac::gfp-rodZ)] cells were grown at 30°C to OD600=0.4–0.5 in M9-mal with no (1) or 250 μM (2,3) IPTG and imaged live with DIC (1,2) or fluorescence (3) optics. Bars equal 5 μm (B) or 2 μm (D, E).
Figure 3
Figure 3
Construction of a functional MreB–RFPSW sandwich fusion, and colocalization of MreB and RodZ. (AD) Construction and analyses of a chromosomally encoded MreB–RFPSW sandwich fusion. (A) The mre loci of wt and mreB-rfpSW strains, illustrating the location of the rfp ORF within that of mreB in strain FB72 and its derivatives, is shown. The annealing sites and orientations of primers A1 and A2 (pair A) and B1 and B2 (pair B) are indicated. These pairs were used to amplify chromosomal DNA of TB28 [wt] (lanes 2 and 3) or FB72/pCX16 [mreB-rfpSW/sdiA] (lanes 4 and 5) by PCR, and the products were analysed by agarose gel electrophoresis. Size standards (in kb) are shown in lane 1. For (B, C), ON cultures of TB28 [wt], FB66 [yhdE<>cat] and FB76 [mreB-rfpSW yhdE<>cat] were diluted in LB to OD600=0.01 and grown at 30°C. Mass doubling rates were determined by measuring OD600 at 1-h intervals. At OD600=0.5, aliquots were used for the determination of cell shape parameters or for the preparation of whole-cell extracts. Note that yhdE<>cat was used as a selectable marker for transduction of the closely linked mreB-rfpSW allele into various strain backgrounds. (B) The cell doubling times and the average cell length and width (n=200) of the three strains are listed. (C) A western blot of the corresponding extracts from strains TB28 (lane 1), FB66 (2) and FB76 (3) is shown. Each lane received 10 μg total protein, and MreB (37.0 kDa, lanes 1 and 2) and MreB–RFPSW (64.3 kDa, lane 3) were detected by using affinity-purified α-MreB antibodies. The positions of 66, 45 and 36 kDa standards are indicated. (D) DIC (D1) and fluorescence (D2) images of FB83 [mreB-rfpSW yhdE<>frt] cells that were grown to OD600=0.5 in M9-mal are shown. Note the normal rod shape of cells, and the spiral-like distribution of MreB–RFPSW. (EG) Colocalization of MreB and RodZ. Corresponding DIC (1), RFP (2), GFP (3) and merged fluorescence (4) images are shown. (E) The colocalization of MreB–RFPSW and GFP–RodZ in rod-shaped cells in which these functional fusions are the only MreB and RodZ proteins present are shown. Note the perfect colocalization in the typical spiral-like cytoskeleton. (F, G) Mreb–RFPSW and GFP–RodZ still colocalize in more disorganized patterns at the periphery of spheroids that are completely devoid of MreC and MreD (F), or of MrdA (PBP2) and MrdB (RodA) (G). The focal plane was near the top of cells in (F, G). (H, I) Location of RodZ in the absence of MreB. Corresponding DIC (1), RFP (2) and GFP (3 and 4) fluorescent images are shown. The panels show the distribution of GFP–RodZ in spheroids that either lack all three Mre proteins (H) or MreB specifically (I). The focal plane was near the top (panels 3) or through the interior (panels 4) of the spheroids. Note the even distribution of GFP–RodZ along the cell membrane, including along that of an intra-cytoplasmic vesicle visible in (I) (arrow). Strains used for (E–I) were: FB101(iFB273) [mreB-rfpSW ΔrodZ (Plac::gfp-rodZ)] (E), FB95(iFB273)/pTB63 [mreB-rfpSW ΔmreCD(Plac::gfp-rodZ)/ftsQAZ] (F), FB90(iFB273)/pTB63 [mreB-rfpSW ΔmrdAB(Plac::gfp-rodZ)/ftsQAZ] (G), FB30(λFB237)/pTB63 [ΔmreBCD(Plac::gfp-rodZ)/ftsQAZ] (H) and FB30(λFB237)/pTB63/pFB206 [ΔmreBCD (Plac::gfp-rodZ)/ftsQAZ /PBAD::mreCD] (I). Cells were grown ON in M9-mal with 250 μM IPTG and either no (E–H) or 0.05% (I) arabinose. After dilution to OD600=0.1 in the same medium, growth was continued to OD600=0.4–0.6, and cells were imaged live. Note that under the same conditions, pFB206 directs the production of sufficient MreC and MreD to correct the shape defect of a ΔmreCD strain (not shown). Bar equals 2 μm.
Figure 4
Figure 4
RodZ-dependent localization of MreB. (AF) Formation of large aberrant MreB patches in RodZ cells. Corresponding DIC (panels 1) and RFP fluorescence (panels 2) images of live cells are shown. Localization of MreB–RFPSW in ΔmrdAB (A) or ΔrodZ (B, C) spheroids. Note the numerous small fluorescent spots along the periphery of ΔmrdAB cells versus the less numerous and larger patches of MreB–RFPSW that accumulate at the periphery of ΔrodZ cells (arrows) in either minimal (B) or rich (C) medium. Strains used were FB90/pTB63 [mreB-rfpSW ΔmrdAB/ftsQAZ] (A), and FB85/pTB63 [mreB-rfpSW ΔrodZ/ftsQAZ] (B, C). ON cultures in M9-mal were diluted to OD600=0.1 in the same (A, B) or in LB (C) and growth was continued to OD600=0.4–0.5. (D–F) Depletion of RodZ leads to the formation of such MreB patches well before cells become grossly misshapen. The RodZ-depletion strain FB81 [mreB-rfpSW PBAD::rodZ] was grown ON in M9-mal with 0.5% arabinose, diluted to OD600=0.05 (D, E) or OD600=0.01 (F) in LB with 0.5% (D) or no (E, F) arabinose, and growth was continued to OD600=0.4–0.5. Bar equals 2 μm.
Figure 5
Figure 5
The RodZ to MreB ratio is important for rod shape maintenance. (AD) illustrate the effects of overproduction of RodZ (B), MreB (C) or both (D) on cell shape in minimal medium. Arrow heads in (D) point at MreB-enriched zones that form at nucleoid-free gaps in the filaments, and the arrow points at a prominent bulge. Cells of strain FB83 [mreB-rfpsw] harbouring vector pJF188EH [vector] (A), pFB291 [Ptac::rodZ] (B), pFB216 [Ptac::mreB] (C) or both pFB291 and pFB216 (D), were inoculated to OD600=0.005 in M9-mal with appropriate antibiotics and 100 (B) or 250 (A, C, D) μM IPTG. After growth to OD600=0.5, cells were fixed and imaged with DIC (1), RPF (2) or DAPI (D3) optics. Identical effects on cell morphology were seen with TB28 [wt] as host (not shown). (E) Co-enrichment of MreB–RFPSW and GFP–RodZ at large nucleoid-free gaps (arrowheads) at the ends of filaments co-overproducing RodZ and MreB. Cells of strain FB83/pFB299/pFB309 [mreB-rfpsw /Ptac::mreB::rodZ/Psyn135::gfp-rodZ] were grown in M9-mal with 250 μM IPTG to OD600=0.5, fixed and treated with DAPI. DIC (1), DAPI+RFP merged (2), DAPI (3), RFP (4) and GFP (5) fluorescence images are shown. Arrows in panel 1 point at areas of local widening of the cell cylinder at sites where the enrichment zone of the two shape proteins overlaps an adjacent nucleoid. (F) Overexpression levels of RodZ and MreB. TB28 [wt] cells containing the plasmid pairs pJF188EH [vector] and pBAD33 [vector] (1), pFB291 [Ptac::rodZ] and pBAD33 (2), pJF118EH and pFB216 [Ptac::mreB] (3) or pFB291 and pFB216 (4) were grown as described for (A–D) and prepared for quantitative western blot analyses. Each lane received 10 μg total protein and MreB (upper) and RodZ (lower) were detected with specific antisera. Levels relative to wt (lane 1) are given under the relevant lanes. The effects of RodZ and/or MreB overexpression on cell morphology were identical to that shown for FB83 in A–D. Bar equals 2 μm.
Figure 6
Figure 6
Domains required for normal RodZ localization and cell shape. (AI) FB60 [ΔrodZ] (1) and TB28 [wt] (2) cells expressing various GFP-tagged mutant variants of RodZ from a construct integrated at the chromosomal attHK022 site. Construct names are indicated above the panels. The domain architecture of each RodZ variant is depicted above the corresponding cell images: HTH (helix-turn-helix, green); +++ (=JM, juxta-membrane, purple); TM (transmembrane, black); P (periplasmic, grey); + (MalF1−14, yellow); M (MalF17−39, yellow); RFP (mCherry, red). Each variant contained GFP at its N terminus (not indicated). Cells were grown ON at 30°C in M9-mal with 250 μM IPTG, and diluted to OD600=0.05 in fresh medium. Growth was continued to OD600=0.3–0.5, and cells were imaged live with DIC and GFP fluorescence optics. (F3, F4) show the presence of faint foci (arrows) within the peripheral haze formed by GFP–RodZ83−337 (ΔHTH-RodZ) in two cells of strain FB60(iYT27), imaged with focus through the middle (middle image) or near the top (lower image) of the cells. Bar equals 2 μm.

References

    1. Bendezu FO, de Boer PA (2008) Conditional lethality, division defects, membrane involution, and endocytosis in mre and mrd shape mutants of Escherichia coli. J Bacteriol 190: 1792–1811 - PMC - PubMed
    1. Bernhardt TG, de Boer PA (2004) Screening for synthetic lethal mutants in Escherichia coli and identification of EnvC (YibP) as a periplasmic septal ring factor with murein hydrolase activity. Mol Microbiol 52: 1255–1269 - PMC - PubMed
    1. Cabeen MT, Jacobs-Wagner C (2007) Skin and bones: the bacterial cytoskeleton, cell wall, and cell morphogenesis. J Cell Biol 179: 381–387 - PMC - PubMed
    1. Carballido-Lopez R, Formstone A, Li Y, Ehrlich SD, Noirot P, Errington J (2006) Actin homolog MreBH governs cell morphogenesis by localization of the cell wall hydrolase LytE. Dev Cell 11: 399–409 - PubMed
    1. Daniel RA, Errington J (2003) Control of cell morphogenesis in bacteria: two distinct ways to make a rod-shaped cell. Cell 113: 767–776 - PubMed

Publication types

MeSH terms