. 2009 Jan 21;28(2):99-111.
doi: 10.1038/emboj.2008.257. Epub 2008 Dec 11.

Histone H3 lysine 4 trimethylation marks meiotic recombination initiation sites

Affiliations

Histone H3 lysine 4 trimethylation marks meiotic recombination initiation sites

Valérie Borde et al. EMBO J. .

Abstract

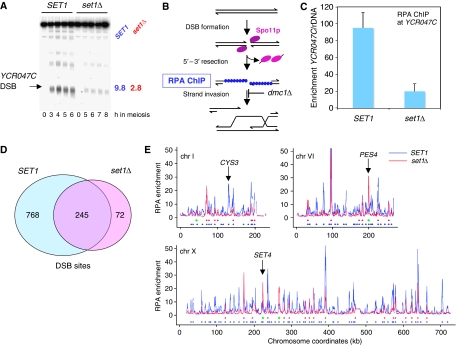
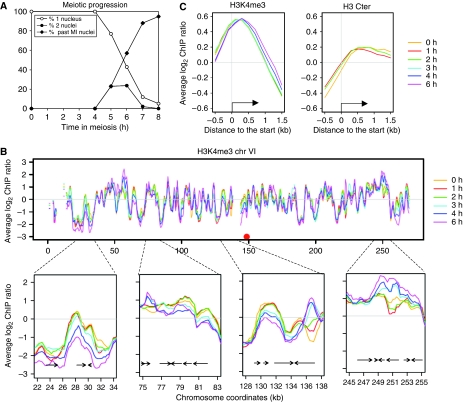
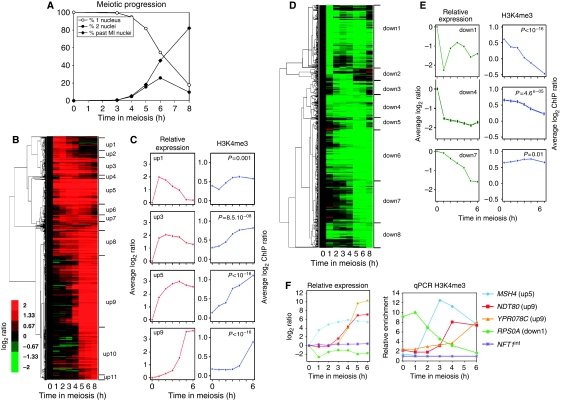
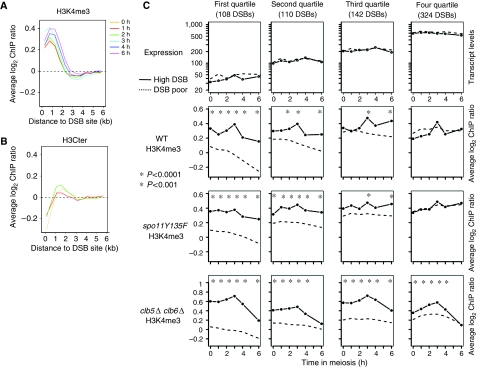
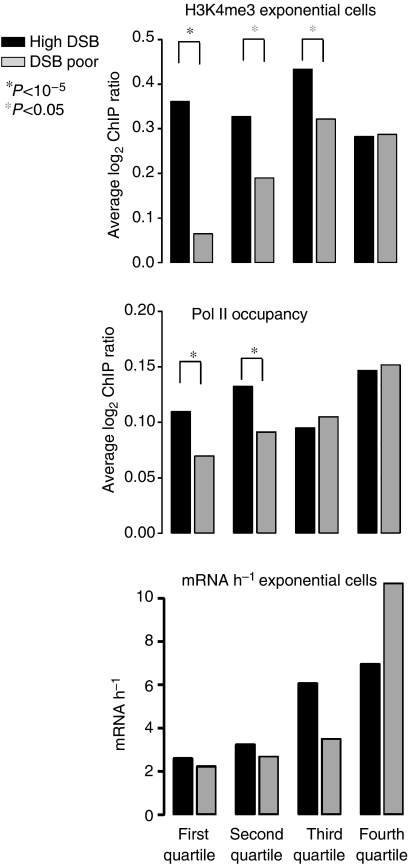
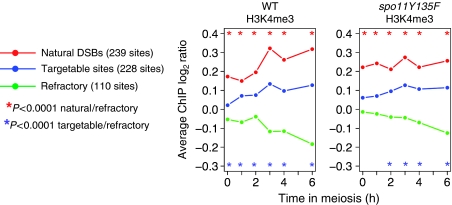
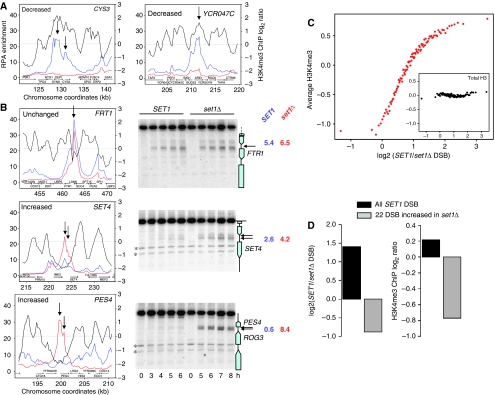
The function of histone modifications in initiating and regulating the chromosomal events of the meiotic prophase remains poorly understood. In Saccharomyces cerevisiae, we examined the genome-wide localization of histone H3 lysine 4 trimethylation (H3K4me3) along meiosis and its relationship to gene expression and position of the programmed double-strand breaks (DSBs) that initiate interhomologue recombination, essential to yield viable haploid gametes. We find that the level of H3K4me3 is constitutively higher close to DSB sites, independently of local gene expression levels. Without Set1, the H3K4 methylase, 84% of the DSB sites exhibit a severely reduced DSB frequency, the reduction being quantitatively correlated with the local level of H3K4me3 in wild-type cells. Further, we show that this differential histone mark is already established in vegetative cells, being higher in DSB-prone regions than in regions with no or little DSB. Taken together, our results demonstrate that H3K4me3 is a prominent and preexisting mark of active meiotic recombination initiation sites. Novel perspectives to dissect the various layers of the controls of meiotic DSB formation are discussed.


Figures

Figure 1
Figure 1
Meiotic DSB formation is globally reduced in the absence of histone H3K4 methylation. (A) Southern blot analysis of DSB formation in the promoter of YCR047C (arrow). The blot contains AseI-digested DNA from meiotic samples of SET1 dmc1Δ (ORD7354) and set1Δ dmc1Δ (ORD9624) cells. Maximal DSB frequencies (% total lane signal) observed during each time course are indicated to the right of the blot. (B) Schematic representation of the procedure using ChIP of RPA to enrich for meiotic DSBs accumulating in dmc1Δ cells. (C) Quantitative PCR measurement of RPA enrichment for sequences close to the YCR047C DSB hot spot relative to ribosomal DNA (rDNA). Data are from two independent samples for each strain taken at 5 h (SET1 dmc1Δ) or 7 h (set1Δ dmc1Δ) in meiosis. Error bars represent standard deviations. (D) The number of DSB sites is strongly reduced in the absence of SET1. The Venn diagram shows the overlap between the DSBs sites occurring in dmc1Δ and in set1Δ dmc1Δ. The DSB peaks were identified from the RPA chip-chip data after smoothing (Supplementary data). (E) Examples of DSBs signals in set1Δ. Three chromosomes are represented. For each one, unsmoothed array signals of RPA enrichment over background are displayed according to their chromosomal coordinates. Below the graphs, blue and red circles indicate positions of the DSB peaks determined in SET1 dmc1Δ and set1Δ dmc1Δ, respectively. Green dots indicate sites stronger in set1Δ. CYS3 is an example of a DSB site no longer cut in set1Δ, whereas PES4 and SET4 sites are stronger in the absence of SET1.
Figure 2
Figure 2
Distribution of histone H3K4me3 during meiosis. (A) Meiotic progression of the wild-type strain (ORD7339) used for the histone H3 and H3K4me3 ChIP-chip experiments. Meiotic divisions of cells transferred to sporulation medium at t=0 h were monitored by fluorescence microscopy of 4′,6′-diamidino-2-phenylindole (DAPI)-stained cells. (B) H3K4me3 distribution during wild-type meiosis along chromosome VI. Profiles are smoothed by a sliding 1 kb window computed every 250 bp. Four examples of regions where the trimethylation pattern varies are enlarged. (C) Average profiles of H3K4me3 or total histone H3 association with chromatin as a function of position relative to the translational start site. All the genes were aligned according to their start site and probes were grouped in bins of 0.2 kb. Average values for each bin are plotted for each indicated time point.
Figure 3
Figure 3
Links between meiotic transcriptional gene regulation and histone H3K4 trimethylation. (A) Meiotic progression of the wild-type strain (ORD8622) used for the transcriptome analysis. The values presented are the average of the three independent time courses used to generate the transcriptome data. (B) Hierarchical clustering of the 1074 meiotically upregulated genes. Genes are grouped according to their induction pattern. The name of the clusters up1–up11 is indicated. The colour code reflects the quantitative change of expression relative to time 0 h. (C) Left panels: average expression change relative to time 0 h along meiosis for a subset of upregulated clusters. Right panels: on the 0–500 bp region of each gene of the same clusters, the average level of H3K4 trimethylation was estimated after ChIP and microarray hybridization and represented as a function of time during meiosis. (D) Hierarchical clustering of the 723 downregulated genes. Eight clusters down1–down8 are defined. Other legends as in (B). (E) Average expression changes along meiosis for a subset of downregulated genes clusters. Other legends as in (C). (F) Meiotic variations of H3K4me3 in selected meiotically induced or repressed genes. The relative expression profile obtained from the transcriptome analysis is shown for each gene for comparison (left). Quantitative measurement of H3K4me3 by qPCR (right). Enrichment values were normalized to the enrichment value of NFT1int, an internal sequence of the large NFT1 gene, used for background H3K4me3 control.
Figure 4
Figure 4
DSB sites are constitutively hypertrimethylated, independently of transcript levels. (A) Average H3K4me3 as a function of the distance from the DSB sites. All the 1013 DSB hot spot sites were aligned and probes were grouped in bins of 0.5 kb. Average values for each bin are plotted for each indicated time point. (B) Average total H3 levels as a function of the distance from the DSB sites. Same legend as in (A). (C) The non-regulated genes were divided into four quartiles according to their average transcript levels during meiosis. Then DSB sites were examined in each category, both for expression levels of the adjacent genes (top panel), and for H3K4me3 (bottom panels). Profiles of control DSB-poor regions were also calculated for each quartile (dotted lines), as described in Supplementary data. Stars indicate a significant difference between DSB-high and DSB-poor regions. WT, ORD7339; spo11Y135F, ORD7341; clb5Δ clb6Δ, ORD6830.
Figure 5
Figure 5
Hypertrimethylation of future DSB sites preexists in exponentially growing cells, and shows more RNA Polymerase II occupancy. For each of the same meiotic transcription quartiles as in Figure 4, we profiled H3K4me3 in exponentially WT growing cells (ORD7339, top panel). In the middle panel, we determined Pol II occupancy, according to published results (Steinmetz et al, 2006), close or not to DSB sites, in each quartile. The bottom panel shows, in each quartile, the transcription levels determined in exponentially growing cells (Holstege et al, 1998), close or not to a DSB site.
Figure 6
Figure 6
H3K4 trimethylation levels close to the natural DSB or targetable sites. Average H3K4me3 levels are compared among regions where a DSB made by the endogenous Spo11 is observed (natural), those where DSB can be artificially introduced when Gal4BD–Spo11 or QQR–Spo11 is targeted there (targetable) and those where Gal4BD–Spo11 or QQR–Spo11 is targeted but does not cleave (refractory). The different categories of regions were defined by Robine et al (2007) and Uematsu et al (unpublished data). To obtain the H3K4me3 profile of each category along meiosis, we averaged the H3K4me3 level of all the probes spanning the defined DSB regions in each category. Stars indicate a significant difference between the indicated categories of regions (Wilcoxon test).
Figure 7
Figure 7
Correlation between DSB variation in set1Δ versus wild-type cells and local H3K4me3 levels. (A) DSB formation at the YCR047C (BUD23) and the CYS3 loci occurs in an H3K4me3 peak and is strongly reduced in the absence of Set1. Left y axis: DSB enrichment for SET1 dmc1Δ (blue) and set1Δ dmc1Δ (red). Right y axis: H3K4me3 enrichment from exponentially growing WT cells (ORD7339). The arrow shows the DSB site. (B) Example of DSB sites not affected by set1Δ, in the FTR1 promoter, or increased in set1Δ (SET4 and PES4). Left: graph showing the properties of the locus, as in (A). Right: Southern blot measurement of DSB formation at the locus, both in SET1 and in set1Δ. Restriction digest and probes are in Supplementary data. In both panels, the arrows show the DSB sites. On the right of each blot is indicated the maximal DSB frequency observed in each strain. (C) All the significant 41500 array elements were grouped in 100 groups of 415 probes according to their ratio of dmc1Δ/set1Δ dmc1Δ RPA enrichment. Each dot represents one such group. For each group, arranged according to this ratio (x axis), the average H3K4me3 level measured in exponentially growing cells is indicated (y axis, top panel). Inset: average levels of total histone H3 measured at t=0 h of meiosis in the same groups, showing that the effect observed is linked specifically to H3K4 trimethylation and not to varying histone H3 levels. (D) Characteristics of the 22 sites that show increased DSB frequency in set1Δ, in terms of increase in DSB frequency compared with SET1 (left panel) and H3K4me3 levels, measured in exponentially growing cells (right panel).

Comment in

Similar articles

Cited by

References

    1. Abdullah MF, Borts RH (2001) Meiotic recombination frequencies are affected by nutritional states in Saccharomyces cerevisiae. Proc Natl Acad Sci USA 98: 14524–14529 - PMC - PubMed
    1. Barski A, Cuddapah S, Cui K, Roh TY, Schones DE, Wang Z, Wei G, Chepelev I, Zhao K (2007) High-resolution profiling of histone methylations in the human genome. Cell 129: 823–837 - PubMed
    1. Baudat F, Nicolas A (1997) Clustering of meiotic double-strand breaks on yeast chromosome III. Proc Natl Acad Sci USA 94: 5213–5218 - PMC - PubMed
    1. Berger SL (2007) The complex language of chromatin regulation during transcription. Nature 447: 407–412 - PubMed
    1. Bergerat A, de Massy B, Gadelle D, Varoutas PC, Nicolas A, Forterre P (1997) An atypical topoisomerase II from Archaea with implications for meiotic recombination. Nature 386: 414–417 - PubMed

Publication types

MeSH terms

Associated data