. 2009 Feb;16(2):262-78.
doi: 10.1038/gt.2008.165. Epub 2008 Dec 11.

Neural stem cells target intracranial glioma to deliver an oncolytic adenovirus in vivo

Affiliations

Neural stem cells target intracranial glioma to deliver an oncolytic adenovirus in vivo

M A Tyler et al. Gene Ther. 2009 Feb.

Abstract

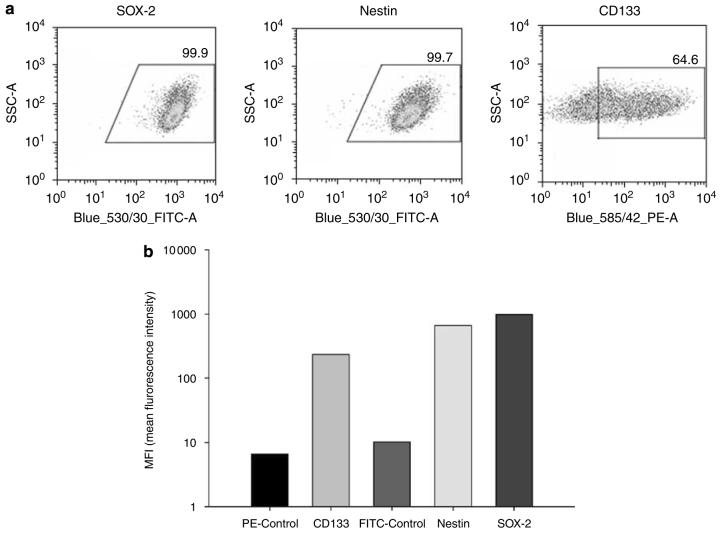
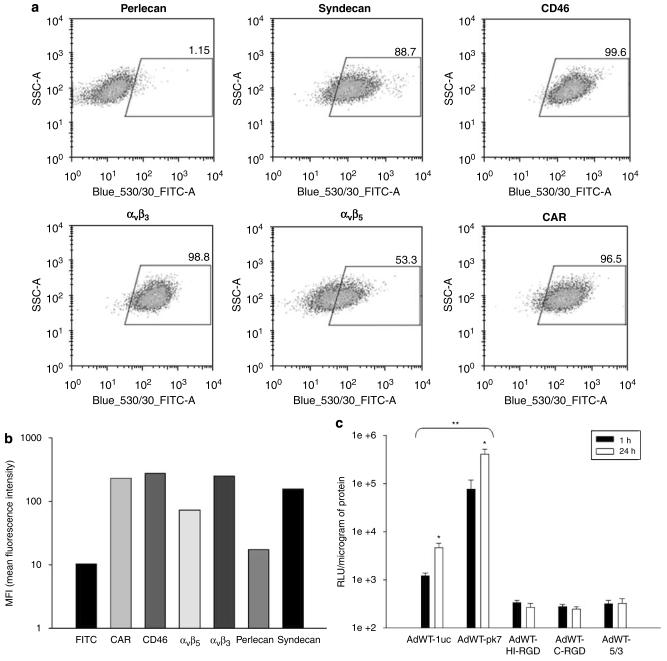
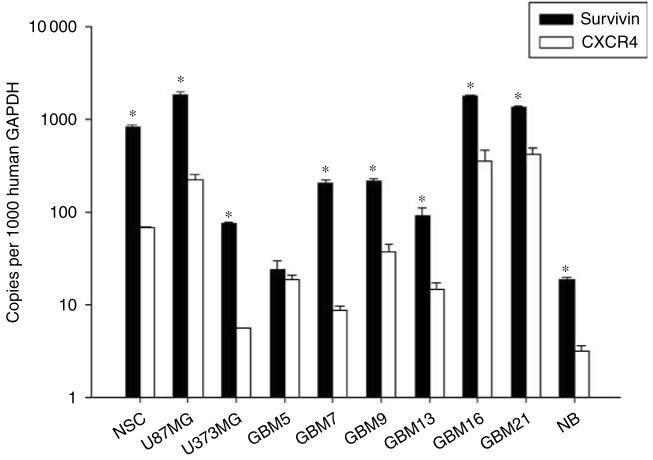
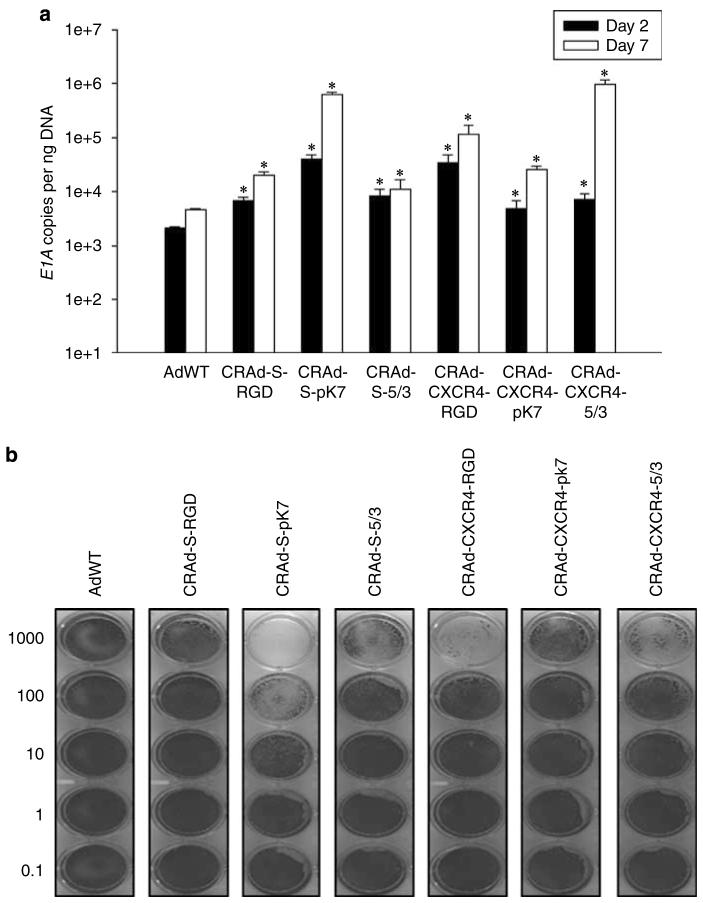
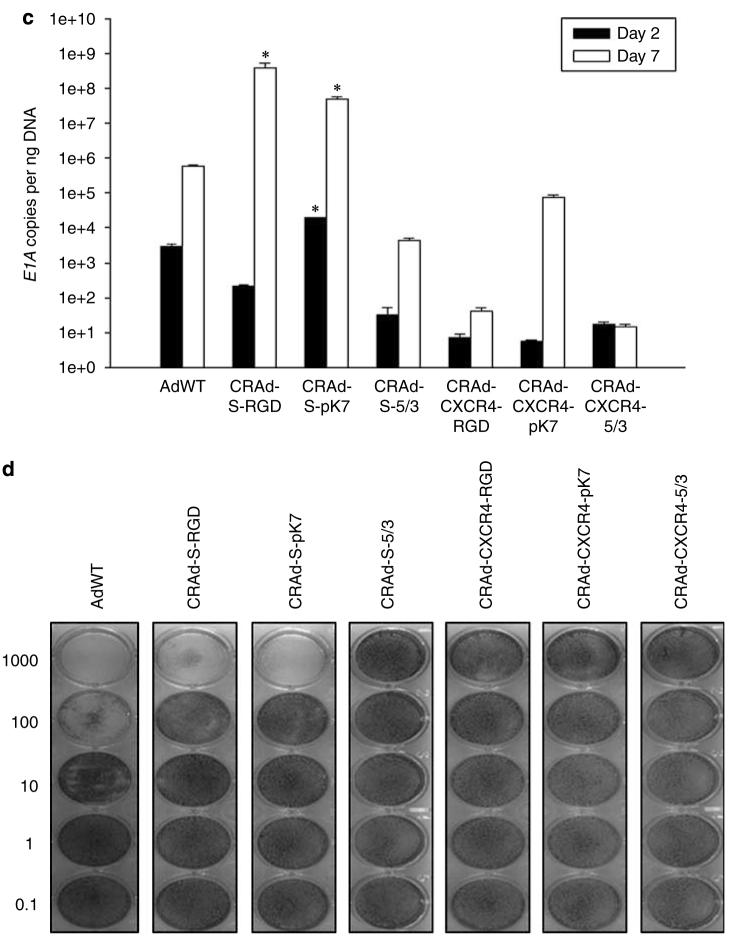
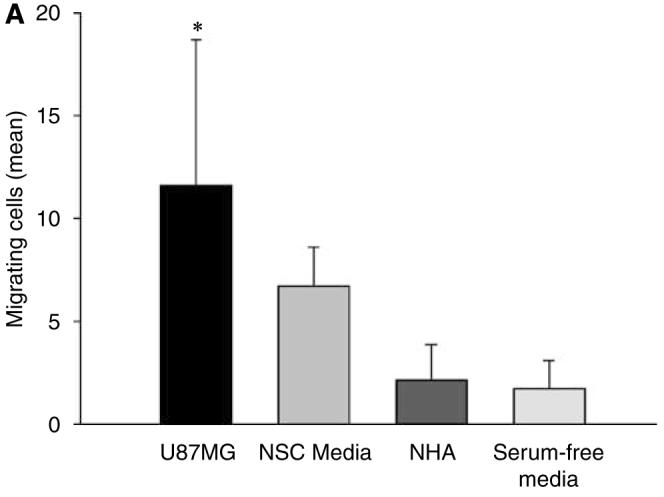
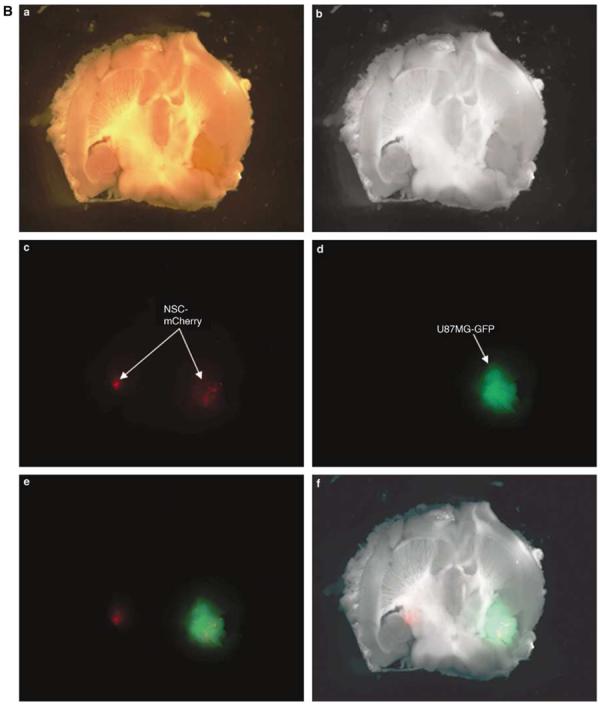
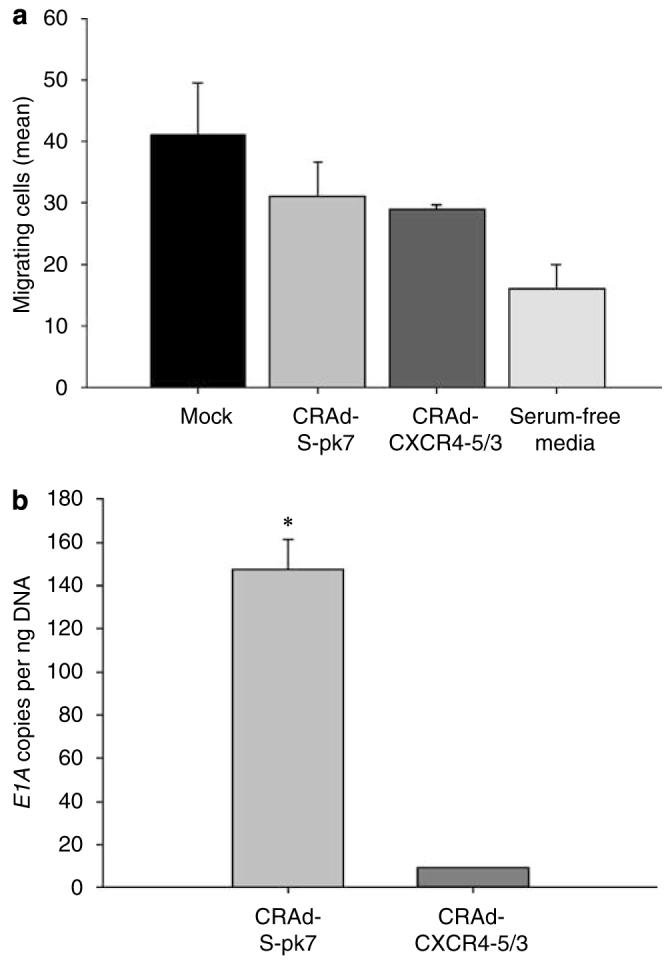
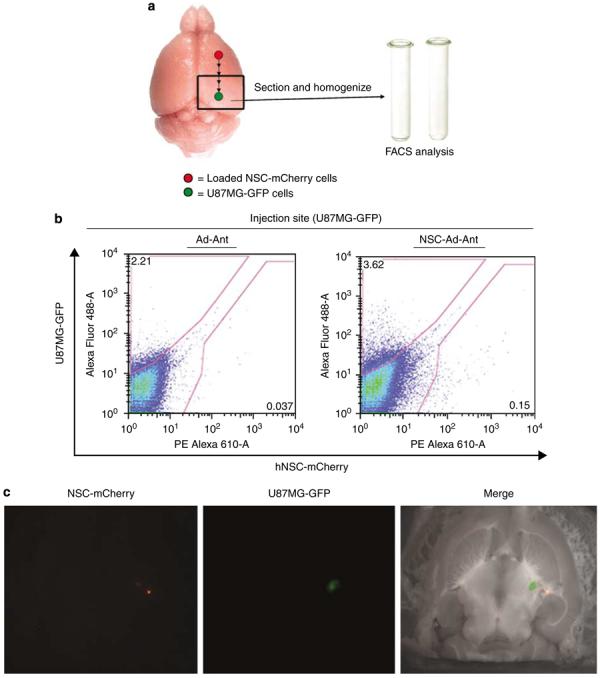
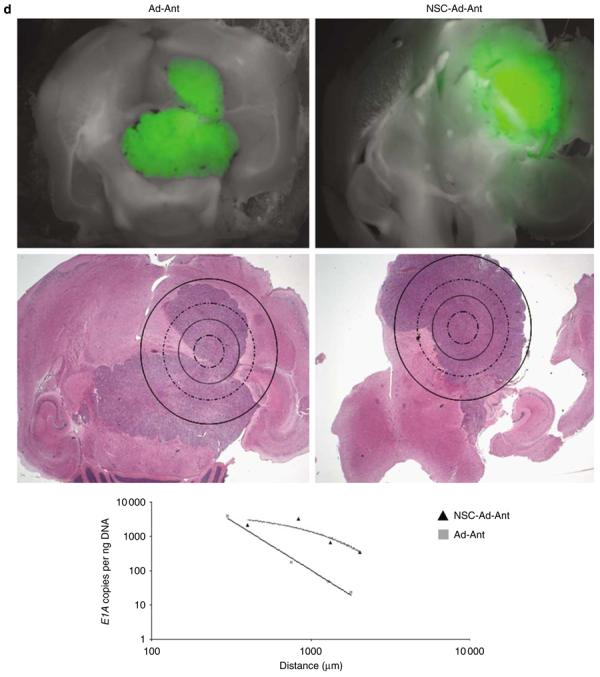
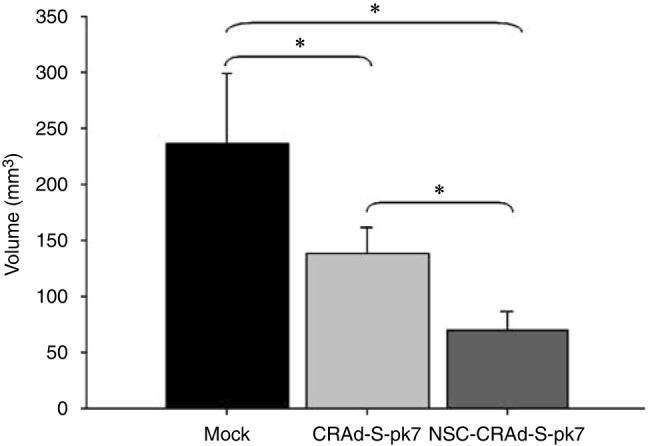
Adenoviral oncolytic virotherapy represents an attractive treatment modality for central nervous system (CNS) neoplasms. However, successful application of virotherapy in clinical trials has been hampered by inadequate distribution of oncolytic vectors. Neural stem cells (NSCs) have been shown as suitable vehicles for gene delivery because they track tumor foci. In this study, we evaluated the capability of NSCs to deliver a conditionally replicating adenovirus (CRAd) to glioma. We examined NSC specificity with respect to viral transduction, migration and capacity to deliver a CRAd to tumor cells. Fluorescence-activated cell sorter (FACS) analysis of NSC shows that these cells express a variety of surface receptors that make them amenable to entry by recombinant adenoviruses. Luciferase assays with replication-deficient vectors possessing a variety of transductional modifications targeted to these receptors confirm these results. Real-time PCR analysis of the replication profiles of different CRAds in NSCs and a representative glioma cell line, U87MG, identified the CRAd-Survivin (S)-pk7 virus as optimal vector for further delivery studies. Using in vitro and in vivo migration studies, we show that NSCs infected with CRAd-S-pk7 virus migrate and preferentially deliver CRAd to U87MG glioma. These results suggest that NSCs mediate an enhanced intratumoral distribution of an oncolytic vector in malignant glioma when compared with virus injection alone.


Figures

Figure 1
Figure 1
Expression of neural stem cell markers. NSCs were stained to measure their expression of SOX-2, nestin and CD133 and subsequently analyzed by flow cytometry. (a) Flow cytometric dot plots depict the percentage of cells undergoing shifts in fluorescence intensity. Gates were drawn based on a negative control, which consisted of NSCs incubated only with FITC- or PE-conjugated antibodies. (b) Bar graphs represent the average mean fluorescence intensities (MFI) of each stem marker, indicating the relative amount of each protein expressed in NSCs. Each experiment was repeated twice.
Figure 2
Figure 2
NSCs express adenoviral target receptors and permit efficient gene transduction by recombinant adenoviral vectors. (a) Flow cytometric analysis of surface receptors targeted by recombinant adenovirus vectors. Dot plots represent the percentage of cells undergoing shifts in fluorescence intensity. (b) Bar graph representing average MFI values (y-axis) for each adenoviral receptor (x-axis). (c) Transduction of NSCs with recombinant Ad vectors was analyzed by luciferase activity. The level of transduction with each vector (x-axis) is represented on the y-axis as relative light units (RLUs)/mg protein. *P-value <0.05 vs time; **P-value <0.05 vs AdWT.
Figure 3
Figure 3
Transcriptional targeting of oncolytic vectors. Survivin and CXCR4 transcriptional activity in NSCs, human glioma and normal tissue. Quantitative RT-PCR analysis was performed to measure the transcriptional activity of survivin and CXCR4 in NSCs, glioma cells lines (U87MG, U373MG), human glioblastoma multiforme tissue specimen (GBM) and normal brain tissue (NB). *P-value <0.05 vs CXCR4.
Figure 4
Figure 4
Replication and cytotoxicity profiles of oncolytic adenoviral vectors in U87MG and NSCs. The replicative capacity of each indicated vector was measured using quantitative RT-PCR. The extent of genome amplification in each cell type was determined by measuring the number of viral E1A copy numbers per nanogram of DNA. Genome amplification was quantified at 2 days (black bars) and 7 days (white bars) after initial infection with each vector in U87MG (a) or NSCs (c). The cytotoxicity of each viral vector was also assessed in U87MG (b) or NSCs (d) using crystal violet staining of cell monolayers. Cells were infected with each vector at the indicated doses (1000–0.1 vp (viral particles) per cell), and the degree of cell monolayer confluency was assessed 10 days after the day of infection. Cell lysis and consequent monolayer disruption are indicated by transparent regions in a well, whereas a lack of replicative cytotoxicity is indicated by a monolayer of cells that stain dark and appear opaque. *P-value <0.05 vs AdWT.
Figure 4
Figure 4
Replication and cytotoxicity profiles of oncolytic adenoviral vectors in U87MG and NSCs. The replicative capacity of each indicated vector was measured using quantitative RT-PCR. The extent of genome amplification in each cell type was determined by measuring the number of viral E1A copy numbers per nanogram of DNA. Genome amplification was quantified at 2 days (black bars) and 7 days (white bars) after initial infection with each vector in U87MG (a) or NSCs (c). The cytotoxicity of each viral vector was also assessed in U87MG (b) or NSCs (d) using crystal violet staining of cell monolayers. Cells were infected with each vector at the indicated doses (1000–0.1 vp (viral particles) per cell), and the degree of cell monolayer confluency was assessed 10 days after the day of infection. Cell lysis and consequent monolayer disruption are indicated by transparent regions in a well, whereas a lack of replicative cytotoxicity is indicated by a monolayer of cells that stain dark and appear opaque. *P-value <0.05 vs AdWT.
Figure 5
Figure 5
NSCs migrate in response to glioma. (A) An in vitro migration assay was conducted using a migration chamber (see Materials and methods section). NSC, NHA, U87MG cells were cultured for 24 h in serum-free or growth factor-free (NSC) media. After a 24-h incubation period, the medium from each cell type was placed in the bottom of the migration assay chamber. Cells that migrated through the porous membrane in response to the conditioned media were quantified by counting the number of migrating cells in five random × 10 field views. The bar graphs represent the average number of migrating cells per × 10 high-power field (± s.d.). As shown, NSCs migrate preferentially in response to media conditioned from U87MG cells (11.63±7.06) and not normal human astrocytes (2.12±1.75; P<0.05) (B) In vivo assessment of NSC migratory potential toward malignant glioma. A total of 5 × 10⁵ U87MG-GFP cells were injected into the right hemisphere of male nude mice. Two weeks later, 5 × 10⁴ NSC-mCherry cells were injected directly contralateral to the site of U87MG-GFP injection. To observe NSC-mCherry migration, mice were killed, brains were extracted and underwent serial 500 μm axial sectioning on a vibratome until a total cut depth of 3 mm was reached. The data presented show a mouse brain that was extracted 12 days after NSC-mCherry implantation. Images were captured using a fluorescent stereomicroscope. (a) Bright phase image of mouse brain; (b) grayscale rendering; (c) live NSC-mCherry cells visualized using the Cy3 channel (red band-pass filter); (d) U87MG-GFP cells are visualized using a GFP channel (green band-pass filter); (e) overlay of Cy3 and GFP channels and (f) overlay of grayscale, GFP and Cy3 captured images. *P-value <0.05.
Figure 5
Figure 5
NSCs migrate in response to glioma. (A) An in vitro migration assay was conducted using a migration chamber (see Materials and methods section). NSC, NHA, U87MG cells were cultured for 24 h in serum-free or growth factor-free (NSC) media. After a 24-h incubation period, the medium from each cell type was placed in the bottom of the migration assay chamber. Cells that migrated through the porous membrane in response to the conditioned media were quantified by counting the number of migrating cells in five random × 10 field views. The bar graphs represent the average number of migrating cells per × 10 high-power field (± s.d.). As shown, NSCs migrate preferentially in response to media conditioned from U87MG cells (11.63±7.06) and not normal human astrocytes (2.12±1.75; P<0.05) (B) In vivo assessment of NSC migratory potential toward malignant glioma. A total of 5 × 10⁵ U87MG-GFP cells were injected into the right hemisphere of male nude mice. Two weeks later, 5 × 10⁴ NSC-mCherry cells were injected directly contralateral to the site of U87MG-GFP injection. To observe NSC-mCherry migration, mice were killed, brains were extracted and underwent serial 500 μm axial sectioning on a vibratome until a total cut depth of 3 mm was reached. The data presented show a mouse brain that was extracted 12 days after NSC-mCherry implantation. Images were captured using a fluorescent stereomicroscope. (a) Bright phase image of mouse brain; (b) grayscale rendering; (c) live NSC-mCherry cells visualized using the Cy3 channel (red band-pass filter); (d) U87MG-GFP cells are visualized using a GFP channel (green band-pass filter); (e) overlay of Cy3 and GFP channels and (f) overlay of grayscale, GFP and Cy3 captured images. *P-value <0.05.
Figure 6
Figure 6
NSCs deliver an oncolytic virus to U87MG cells in vitro. (a) The ability of NSCs to deliver the two oncolytic adenoviruses, CRAd-CXCR4-5/3 and CRAd-S-pk7, to U87MG cells was assessed using the same migration plate and assay methods used in Figure 5a. NSCs were incubated with each vector for 1 h at a viral titer of 100 vp/cell. After loading of NSCs, cells were lifted and plated in multiwell migration inserts (105 NSCs/well) above U87MG cells, which had been plated 2 days before NSC plating. Twenty-four hours after plating of loaded or non-loaded NSCs, the number of migrating cells was quantified. Bar graph represents the average number of migrating cells counted per random × 10 field view. (b) The ability of NSCs to deliver a replicating adenovirus was assessed by removing the cells at the bottom of the chamber and quantifying the number of viral E1A copy numbers 48 h after initial plating of NSCs at the top of the migration chamber. The graph represents the number of viral E1A copies that were quantified from cells in the bottom of the migration chamber. *P-value <0.05.
Figure 7
Figure 7
NSCs deliver CRAd-S-pk7 oncolytic adenovirus and enhance vector distribution in an intracranial glioma model. Experimental schematics (a). The presence of live, loaded NSC-mCherry cells at the site of U87MG-GFP implantation was assessed by flow cytometry (b). The data shown represent nude mouse brains that were extracted 4 days after loaded NSC-mCherry or CRAd-S-pk7 were injected at a site anterior to the tumor injection site (18 days after U87MG-GFP implantation). The presence of U87MG-GFP is represented by an upward shift on the y-axis (AlexaFluor488-A; green band-pass filter), whereas the presence of NSC-mCherry cells is indicated by a rightward shift on the x-axis (PE Alexa 610-A; red band-pass filter). A shift on both axes describes the presence of both NSC-mCherry and U87MG-GFP cells in roughly the same anatomical location of the brain (U87MG-GFP injection site). Numbers on representative dot plots indicate the percentage of total cells processed (total: 50 000 events collected and recorded). The presence of loaded NSC-mCherry cells with respect to U87MG-GFP was also assessed by fluorescence microscopy 4 days after injection of loaded NSC-mCherry injection anterior to the U87MG-GFP injection site. Left: Cy3 (red) band-pass filter was used to detect the presence of live NSC-mCherry cells. Middle: GFP (green) band-pass filter channel was used to detect the presence of live U87MG-GFP cells. Right: Merged image (Grayscale+Cy3+GFP) (c). Laser capture microdissection (LCM) analysis and qPCR assessment of CRAd distribution (d). To investigate the role of NSC in CRAd distribution throughout U87MG-GFP tumors, mice were killed at day 12 after loaded NSC-mCherry implantation anterior to the tumor injection site (26 days after U87MG-GFP implantation). After fluorescent microscope observations were recorded, the same mice brains were fixed and embedded in paraffin tissue blocks. The processed tissue then underwent serial 6 μm sections onto glass slides or slides specifically made for LCM analysis. After the injection site had been identified by H&E, sections of tissue were laser-captured at varying distances from the injection site in separate tubes. DNA was extracted from the collected tissue and the number of viral E1A copy numbers was quantified by PCR techniques. As shown (middle row, H&E), tissue was collected separately at increasing distances from the identified injection site by drawing concentric circles of increasing diameter around the injection site. Viral E1A copy numbers were quantified (y-axis) as a function of the distance from the injection site (x-axis). Best-fit trend lines and equations were obtained using Microsoft Excel. Data shown are representative of n = 4 mice from each group killed at day 12 after viral injection anterior to the tumor injection site (loaded or Ad by itself). Ad: CRAd-S-pk7; Ant: anterior injection; NSC: NSC-mCherry.
Figure 7
Figure 7
NSCs deliver CRAd-S-pk7 oncolytic adenovirus and enhance vector distribution in an intracranial glioma model. Experimental schematics (a). The presence of live, loaded NSC-mCherry cells at the site of U87MG-GFP implantation was assessed by flow cytometry (b). The data shown represent nude mouse brains that were extracted 4 days after loaded NSC-mCherry or CRAd-S-pk7 were injected at a site anterior to the tumor injection site (18 days after U87MG-GFP implantation). The presence of U87MG-GFP is represented by an upward shift on the y-axis (AlexaFluor488-A; green band-pass filter), whereas the presence of NSC-mCherry cells is indicated by a rightward shift on the x-axis (PE Alexa 610-A; red band-pass filter). A shift on both axes describes the presence of both NSC-mCherry and U87MG-GFP cells in roughly the same anatomical location of the brain (U87MG-GFP injection site). Numbers on representative dot plots indicate the percentage of total cells processed (total: 50 000 events collected and recorded). The presence of loaded NSC-mCherry cells with respect to U87MG-GFP was also assessed by fluorescence microscopy 4 days after injection of loaded NSC-mCherry injection anterior to the U87MG-GFP injection site. Left: Cy3 (red) band-pass filter was used to detect the presence of live NSC-mCherry cells. Middle: GFP (green) band-pass filter channel was used to detect the presence of live U87MG-GFP cells. Right: Merged image (Grayscale+Cy3+GFP) (c). Laser capture microdissection (LCM) analysis and qPCR assessment of CRAd distribution (d). To investigate the role of NSC in CRAd distribution throughout U87MG-GFP tumors, mice were killed at day 12 after loaded NSC-mCherry implantation anterior to the tumor injection site (26 days after U87MG-GFP implantation). After fluorescent microscope observations were recorded, the same mice brains were fixed and embedded in paraffin tissue blocks. The processed tissue then underwent serial 6 μm sections onto glass slides or slides specifically made for LCM analysis. After the injection site had been identified by H&E, sections of tissue were laser-captured at varying distances from the injection site in separate tubes. DNA was extracted from the collected tissue and the number of viral E1A copy numbers was quantified by PCR techniques. As shown (middle row, H&E), tissue was collected separately at increasing distances from the identified injection site by drawing concentric circles of increasing diameter around the injection site. Viral E1A copy numbers were quantified (y-axis) as a function of the distance from the injection site (x-axis). Best-fit trend lines and equations were obtained using Microsoft Excel. Data shown are representative of n = 4 mice from each group killed at day 12 after viral injection anterior to the tumor injection site (loaded or Ad by itself). Ad: CRAd-S-pk7; Ant: anterior injection; NSC: NSC-mCherry.
Figure 8
Figure 8
NSC-mediated delivery of a CRAd shows an enhanced antitumor effect. Male, athymic (nude) mice received subcutaneous injections of 1 × 10⁶ U87 tumor cells into the right hind leg (flank). One week after tumor implantation, the tumor was visible and the mice received intratumoral injections as follows: 100 μl of PBS solution (MOCK; n = 5); 1 × 10⁹ vp of CRAd-S-pk7 (n = 5) or 1 × 10⁶ NSCs loaded with 1000 vp/cell (1 × 10⁹ vp; n = 5) of CRAd-S-pk7. Ten days after experimental treatment, tumor volumes were recorded for each treatment group. Data are presented as mean tumor volume for each experimental group, with error bars representing standard deviation in a treatment group. *P-value <0.05.

Similar articles

Cited by

References

    1. Tyler MA, Sonabend AM, Ulasov IV, Lesniak MS. Vector therapies for malignant glioma: shifting the clinical paradigm. Expert Opin Drug Deliv. 2008;5:445–458. - PubMed
    1. Borovjagin AV, Krendelchtchikov A, Ramesh N, Yu DC, Douglas JT, Curiel DT. Complex mosaicism is a novel approach to infectivity enhancement of adenovirus type 5-based vectors. Cancer Gene Ther. 2005;12:475–486. - PubMed
    1. Brouwer E, Havenga MJ, Ophorst O, de Leeuw B, Gijsbers L, Gillissen G, et al. Human adenovirus type 35 vector for gene therapy of brain cancer: improved transduction and bypass of pre-existing anti-vector immunity in cancer patients. Cancer Gene Ther. 2007;14:211–219. - PubMed
    1. Miura Y, Yoshida K, Nishimoto T, Hatanaka K, Ohnami S, Asaka M, et al. Direct selection of targeted adenovirus vectors by random peptide display on the fiber knob. Gene Therapy. 2007;14:1448–1460. - PubMed
    1. Paul CP, Everts M, Dent P, Fisher PB, Ulasov IV, Lesniak MS, et al. Characterization of infectivity of Knob-modified adenoviral vectors in glioma. Cancer Biol Ther. 2008;7:786–793. - PubMed

Publication types

MeSH terms