. 2008 Jul;1(4):297-308.
doi: 10.1038/mi.2008.13.

Acute appendicitis is characterized by a uniform and highly selective pattern of inflammatory gene expression

Affiliations

Acute appendicitis is characterized by a uniform and highly selective pattern of inflammatory gene expression

C G Murphy et al. Mucosal Immunol. 2008 Jul.

Abstract

Acute appendicitis (AA) is the most common life-threatening surgical emergency in pediatrics. To characterize the nature of the inflammatory response in AA, gene expression profiles were generated. We found remarkable uniformity in the genes that were differentially expressed between patients with appendicitis and control groups. Sixty-four probe sets were differentially expressed in samples from patients with both severe and mild appendicitis compared to control samples, and within this group we were able to identify four dominant clusters. Interestingly, expression levels of interleukin (IL)-8 significantly correlated with histologic score, and expression of IL-8 protein was observed within both neutrophils and mononuclear cells by immunohistochemistry, suggesting a possible role in the etiology of appendicitis. Although there was some overlap between genes reported to be differentially expressed in Crohn's disease (CD) and those observed in AA, differential expression of genes involved in interferon responses that characterize CD was not observed.


Figures

Figure 1
Figure 1
Correlation of histological score with WBC count and IL-8 expression. Graph of histological score and either WBC count (left) or relative expression of IL-8 determined by RPA (right). Line indicates best fit. Pearson r and P -value as shown. IL-8, interleukin-8; WBC, white blood cell.
Figure 2
Figure 2
Hierarchical clustering of samples. Microarray data sets were clustered by sample, and the hierarchical tree is shown. Sample number and histology score are shown. Appendices 2, 25, 26, and 11 are controls removed for noninflammatory reasons. Samples 19, 22, 4, 5, 6, 9, 13, 7, and 10 were removed for the preoperative diagnosis of acute appendicitis.
Figure 3
Figure 3
Differential gene expression in severe appendicitis. Top: volcano plot of log P -value vs. log fold change comparing the four severe cases of appendicitis with the four control samples. Individual genes shown in pink represent those that have a fold change >5 or < 0.2, and a P -value < 0.05. Bottom: heat map showing hierarchical clustering of the 276 probe sets shown in pink above for all of the 13 appendix samples that were analyzed by microarray. Samples are arranged from lowest to highest histological score, with the four controls on the left.
Figure 4
Figure 4
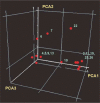
Gene expression in the “negative appendix”. Principal component analysis of 276 genes differentially expressed between severe and control groups. Each red dot represents one sample plotted for PCA1, PCA2, and PCA3, as indicated on each axis. Numbers next to individual red dot or cluster of dots indicate corresponding appendix sample(s).
Figure 5
Figure 5
Immunohistochemical staining for IL-8. Sections of control, negative (no. 22), mild, and severe samples are shown after staining with IL-8 antibody. Original magnification × 200. IL-8, interleukin-8.
Figure 6
Figure 6
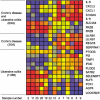
Heat plot of genes differentially expressed in IBD, which are also differentially expressed in AA. Samples are arranged from lowest to highest score with four controls on the left. Genes that are differentially expressed in both AA and IBD are shown. Genes are grouped based on being differentially expressed in either both CD and UC, CD alone, or UC alone, according to ref. 44. Numbers in parentheses refer to the number of genes differentially expressed in both AA and IBD compared to the total number of genes differentially expressed in IBD for each group. Gene symbols are shown on the right. Please note that several genes (IL-8, FRZB, LILRB1) are included twice in a group because two probe sets corresponding to these gene symbols were differentially expressed in AA. These genes are included only once in the numbers in parentheses of genes differentially expressed in both AA and IBD. AA, acute appendicitis; CD, Crohn's disease; IBD, inflammatory bowel disease; IL-8, interleukin-8; UC, ulcerative colitis.

References

    1. Addiss DG, Shaffer N, Fowler BS, Tauxe RV. The epidemiology of appendicitis and appendectomy in the United States. Am. J. Epidemiol. 1990;132:910–925. - PubMed
    1. Scholer SJ, Pituch K, Orr DP, Dittus RS. Clinical outcomes of children with acute abdominal pain. Pediatrics. 1996;98:680–685. - PubMed
    1. Puri P, Rangecroft L, Zervos G, Guiney EJ, O'Donnell B. Perforated appendicitis in children: use of metronidazole for the reduction of septic complications. Z. Kinderchir. 1981;32:111–115. - PubMed
    1. Tsuji M, Puri P, Reen DJ. Characterisation of the local infl ammatory response in appendicitis. J. Pediatr. Gastroenterol. Nutr. 1993;16:43–48. - PubMed
    1. Jones BA, Demetriades D, Segal I, Burkitt DP. The prevalence of appendiceal fecaliths in patients with and without appendicitis. A comparative study from Canada and South Africa. Ann. Surg. 1985;202:80–82. - PMC - PubMed

Publication types