. 2009 Jan;6(1):55-61.
doi: 10.1038/nmeth.1283. Epub 2008 Dec 14.

Cost-effective strategies for completing the interactome

Affiliations

Cost-effective strategies for completing the interactome

Ariel S Schwartz et al. Nat Methods. 2009 Jan.

Abstract

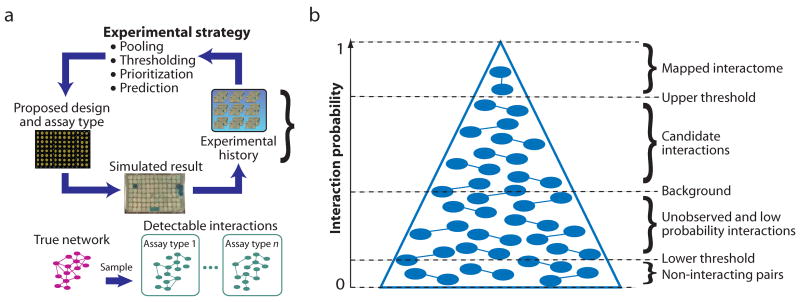
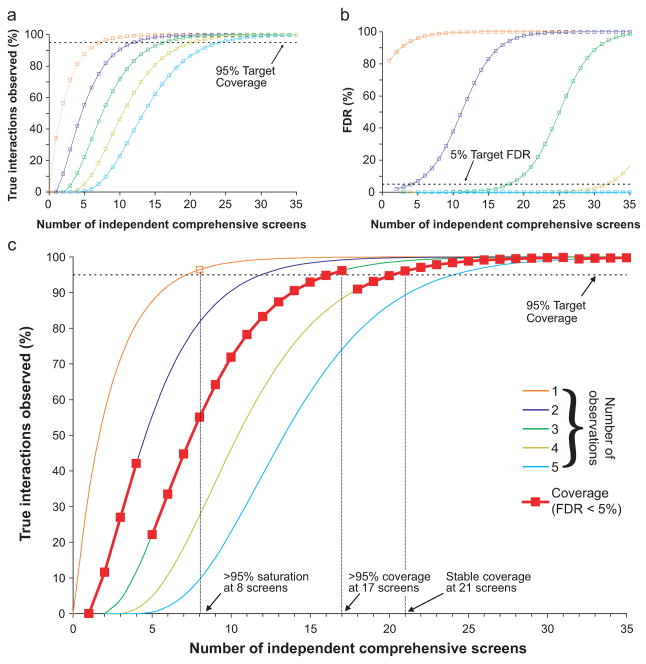
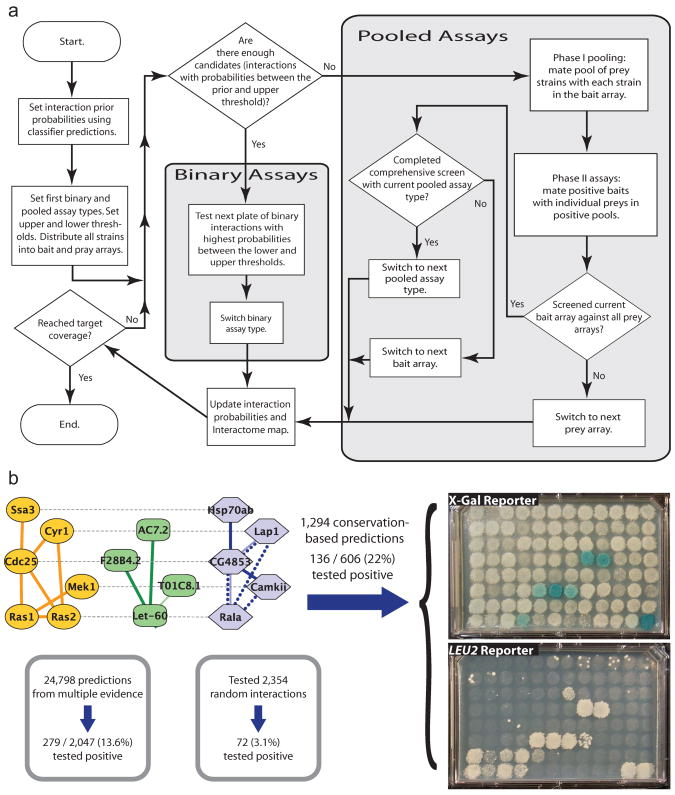
Comprehensive protein-interaction mapping projects are underway for many model species and humans. A key step in these projects is estimating the time, cost and personnel required for obtaining an accurate and complete map. Here we modeled the cost of interaction-map completion for various experimental designs. We showed that current efforts may require up to 20 independent tests covering each protein pair to approach completion. We explored designs for reducing this cost substantially, including prioritization of protein pairs, probability thresholding and interaction prediction. The best experimental designs lowered cost by fourfold overall and >100-fold in early stages of mapping. We demonstrate the best strategy in an ongoing project in Drosophila melanogaster, in which we mapped 450 high-confidence interactions using 47 microtiter plates, versus thousands of plates expected using current designs. This study provides a framework for assessing the feasibility of interaction mapping projects and for future efforts to increase their efficiency.


Figures

Figure 1
Figure 1. Simulating an interaction mapping project
(a) At any given point in the project, every pair of proteins is assigned an interaction probability based on its experimental history (initially these probabilities are set to background or informed by predictions). The interaction probabilities and experimental history are used to design a 96-well plate Y2H experiment according to one of the strategies. The result of this experiment is simulated based on the detectability of the tested interactions (given the assay type) and the pooling sensitivity. The new experimental results are recorded in the history and also (b) used to update the interaction probabilities of the relevant protein pairs. The pyramid represents the ordered list of protein pairs ranked by probability. It is wider at the bottom than at the top to reflect that most pairs are negative—i.e., most pairs will have low probability and only a few pairs will percolate to the top of the list with high probability. Interactions with probability above an upper threshold are added to the mapped interactome, which is compared to the simulated “True Network” at intervals of 1,000 plates for reporting coverage and FDR.
Figure 2
Figure 2. Analysis of the coverage and saturation of the fly interactome as a function of the number of independent screens
(a) The percentage of true interactions that are observed >1 (orange), >2 (purple), >3 (green), >4 (yellow), and >5 (cyan) times as a function of the number of times they are tested with independent assays. Increasing the threshold of independent observations increases the number of independent assays needed to reach the 95% coverage target. (b) The false discovery rate (FDR) of interactions that are observed exactly once (orange), twice (purple), thrice (green), four times (yellow), and five times (cyan) as a function of the number of times they are tested with independent assays. To achieve FDR < 5% interactions should be observed at least twice when tested with < 5 independent assays, and at least three times when tested with 5–17 assays. (c) The effective coverage level at FDR < 5% is shown (red curve) by embedding the observation threshold from (b) into the curves of (a). While saturation is achieved after 8 screens, 21 screens are required for 95% coverage at FDR < 5%.
Figure 3
Figure 3. Fly and Human Interactome coverage costs for different experimental strategies
(a) Comparison of the Pooling strategy (numbers 2.1–2.4) with a Thresholding strategy (numbers 3.1–3.3) which combines pooling with direct experiments based on thresholding and prioritization. (a INSET) Zoomed view showing the number of plates required to add the first 450 interactions to the map using Pooling. (b) Performance of the Prediction strategy (numbers 4.1–4.4) over a range of FPR, FNR, and FDR of the predictions. (b INSET) Zoomed view including an experimental proof-of-principle based on predictions from network conservation (cFwd, cRev) or multiple types of evidence (mFwd, mRev). Fwd and Rev denote the series of experiments performed in the forward then reverse Y2H orientations, respectively. X-axis units of INSETs are absolute number of plates, not millions of plates as for the parent figures (a) and (b).
Figure 4
Figure 4. Design and implementation of the Prediction strategy for mapping the Interactome
(a) State diagram of the Prediction strategy. This strategy combines interaction predictions with direct and pooled experiments to reduce the intermediate and total costs of Interactome mapping. (b) Application of the first steps of the Prediction strategy to the Drosophila interactome using conservation-based predictions from Sharan et al. or predictions made by integrating multiple evidence types (this study). Representative plates are shown for tests of conservation-based predictions using the X-Gal (top) or LEU2 (bottom) reporters.

References

    1. Fields S. High-throughput two-hybrid analysis. The promise and the peril. Febs J. 2005;272:5391–9. - PubMed
    1. Giot L, et al. A protein interaction map of Drosophila melanogaster. Science. 2003;302:1727–36. - PubMed
    1. Ito T, et al. A comprehensive two-hybrid analysis to explore the yeast protein interactome. Proc Natl Acad Sci U S A. 2001;98:4569–74. - PMC - PubMed
    1. Li S, et al. A map of the interactome network of the metazoan C. elegans. Science. 2004;303:540–3. - PMC - PubMed
    1. Rual JF, et al. Towards a proteome-scale map of the human protein-protein interaction network. Nature. 2005;437:1173–8. - PubMed

Publication types

Substances

LinkOut - more resources