. 2009 Jan;30(1):78-89.
doi: 10.1038/aps.2008.4. Epub 2008 Dec 15.

Hydrogen peroxide mobilizes Ca2+ through two distinct mechanisms in rat hepatocytes

Affiliations

Hydrogen peroxide mobilizes Ca2+ through two distinct mechanisms in rat hepatocytes

Hirohiko Sato et al. Acta Pharmacol Sin. 2009 Jan.

Abstract

Aim: Hydrogen peroxide (H2O2) is produced during liver transplantation. Ischemia/reperfusion induces oxidation and causes intracellular Ca2+ overload, which harms liver cells. Our goal was to determine the precise mechanisms of these processes.

Methods: Hepatocytes were extracted from rats. Intracellular Ca2+ concentrations ([Ca2+](i)), inner mitochondrial membrane potentials and NAD(P)H levels were measured using fluorescence imaging. Phospholipase C (PLC) activity was detected using exogenous PIP2. ATP concentrations were measured using the luciferin-luciferase method. Patch-clamp recordings were performed to evaluate membrane currents.

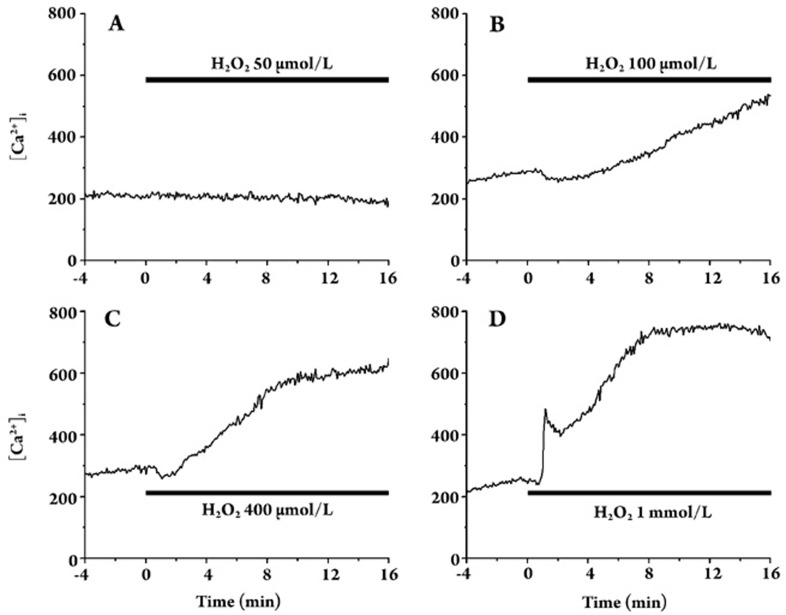
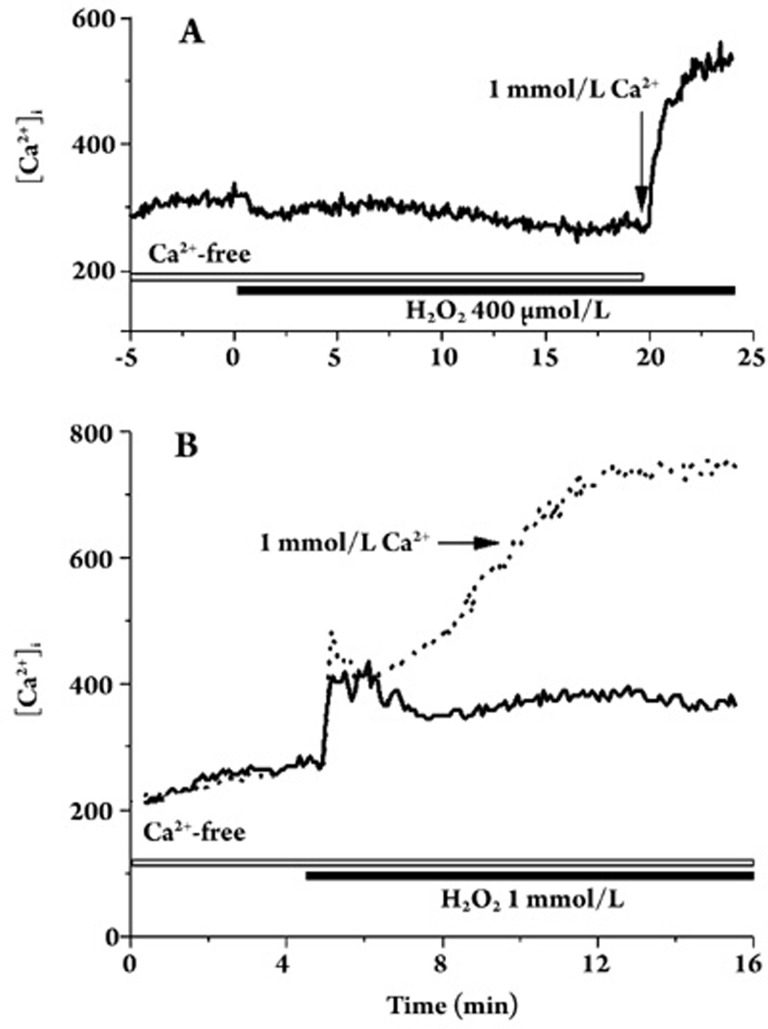
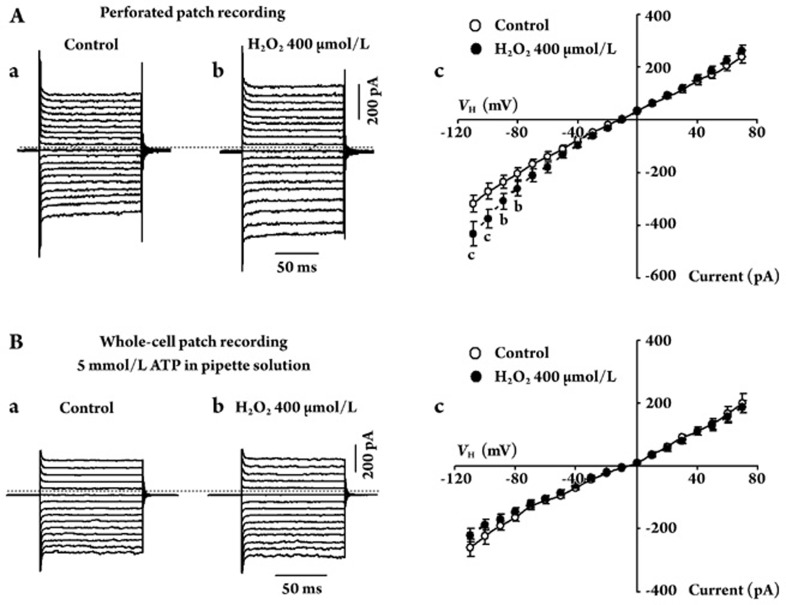
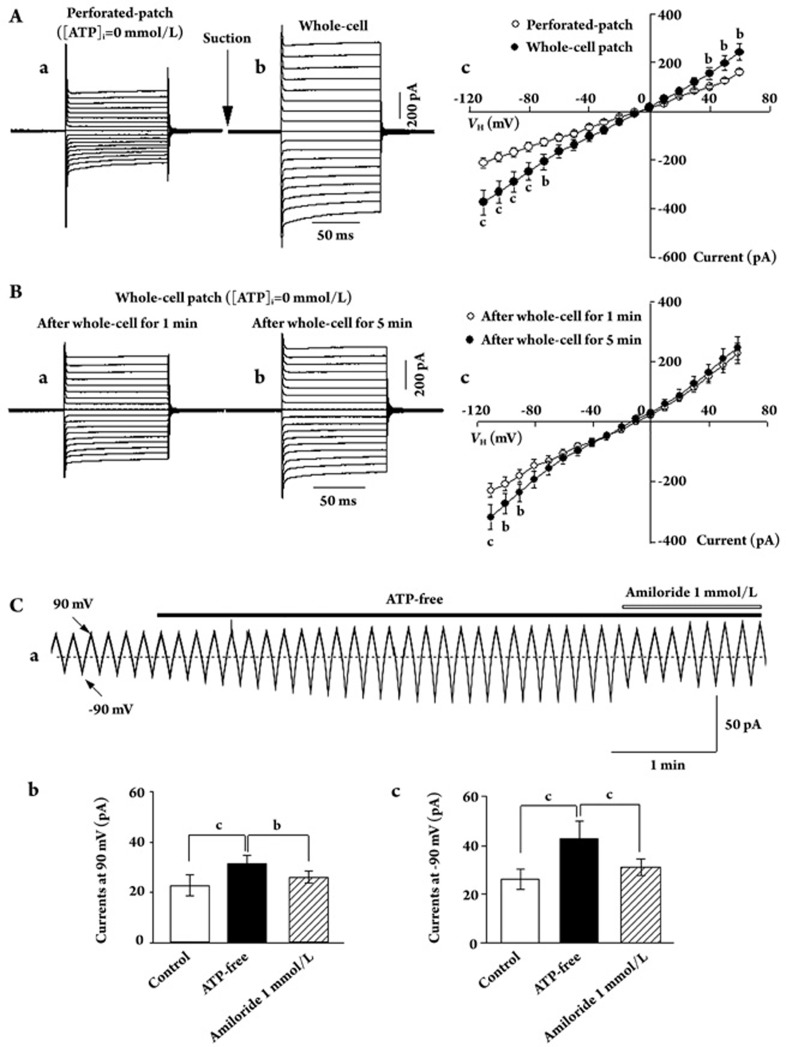
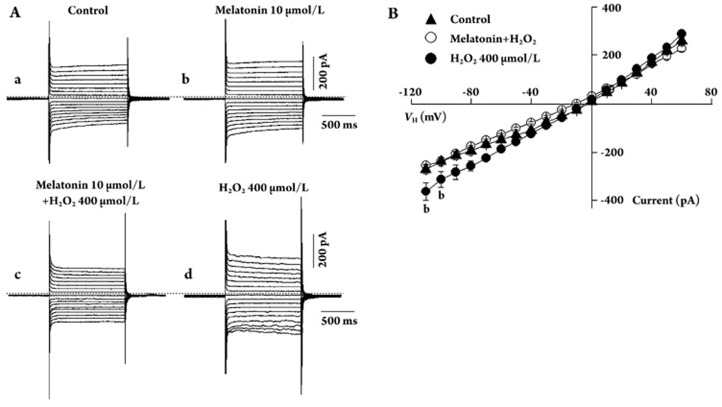
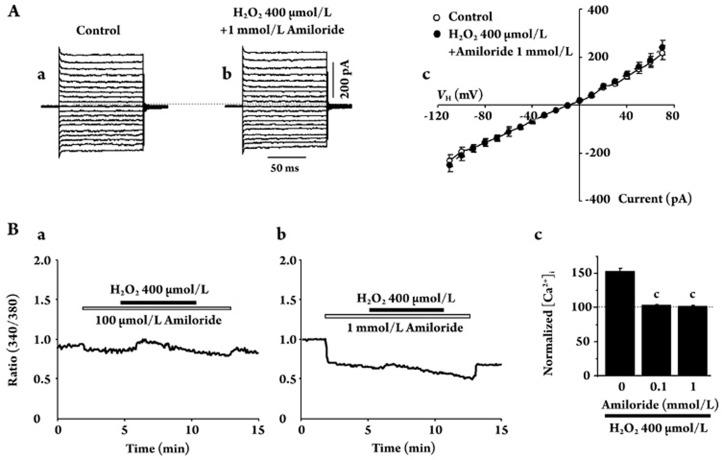
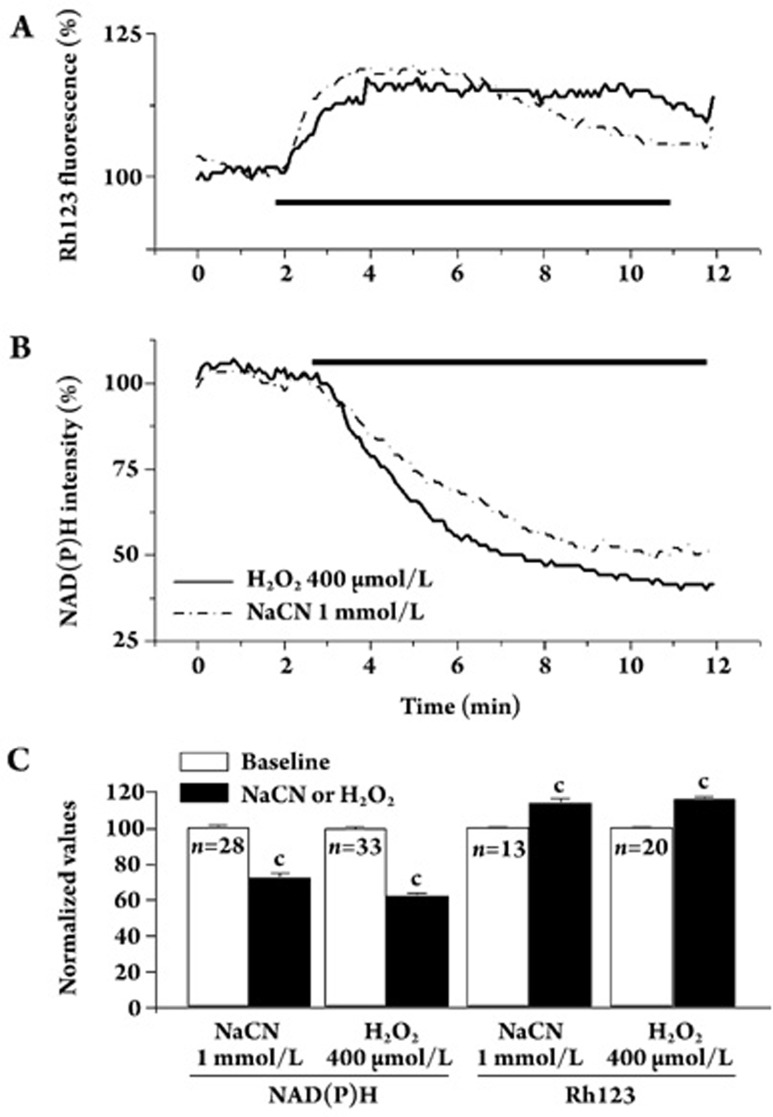
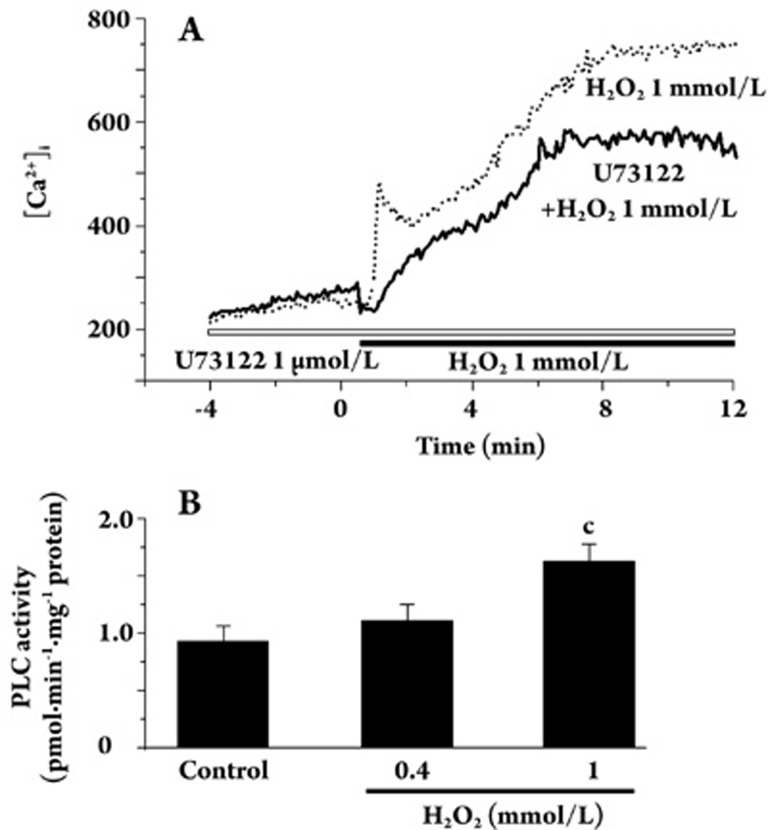
Results: H2O2 increased intracellular Ca2+ concentrations ([Ca2+](i)) across two kinetic phases. A low concentration (400 micromol/L) of H2O2 induced a sustained elevation of [Ca2+](i) that was reversed by removing extracellular Ca2+. H2O2 increased membrane currents consistent with intracellular ATP concentrations. The non-selective ATP-sensitive cation channel blocker amiloride inhibited H2O2-induced membrane current increases and [Ca2+](i) elevation. A high concentration (1 mmol/L)of H2O2 induced an additional transient elevation of [Ca2+](i), which was abolished by the specific PLC blocker U73122 but was not eliminated by removal of extracellular Ca2+. PLC activity was increased by 1 mmol/L H2O2 but not by 400 micromol/L H2O2.

Conclusions: H2O2 mobilizes Ca2+ through two distinct mechanisms. In one, 400 micromol/L H2O2-induced sustained [Ca2+](i) elevation is mediated via a Ca2+ influx mechanism, under which H2O2 impairs mitochondrial function via oxidative stress,reduces intracellular ATP production, and in turn opens ATP-sensitive, non-specific cation channels, leading to Ca2+ influx.In contrast, 1 mmol/L H2O2-induced transient elevation of [Ca2+](i) is mediated via activation of the PLC signaling pathway and subsequently, by mobilization of Ca2+ from intracellular Ca2+ stores.


Figures

Figure 1
Figure 1
H2O2 elevates [Ca2+]i across two kinetic patterns in a concentration-dependent manner. In the presence of 1 mmol/L Ca2+ in the extracellular solution, H2O2 was applied to recorded hepatocytes at the concentrations of 50 μmol/L (A), 100 μmol/L (B), 400 μmol/L (C) and 1 mmol/L (D), and the effects on [Ca2+]i were evaluated. The horizontal bar in each trace indicates the exposure period to H2O2. Representative traces are typical case from 5−12 experiments tested.
Figure 2
Figure 2
Effects of removal of extracellular Ca2+ on H2O2-induced elevation of [Ca2+]i. (A) Under extracellular Ca2+-free conditions (open horizontal bar), 400 μmol/L H2O2 failed to induce a detectable elevation of [Ca2+]i, and the reperfusion of 1 mmol/L extracellular Ca2+ (indicated by arrow) induced an elevation of [Ca2+]i. (B) Under the same extracellular Ca2+-free conditions, 1 mmol/L H2O2 still induced a transient, initial elevation of [Ca2+]i, but the sustained phase of elevation of [Ca2+]i was abolished. The dashed trace represents 1 mmol/L H2O2-induced elevation of [Ca2+]i in the presence of 1 mmol/L extracellular Ca2+. Representative traces in (A) and (B) are typical cases from 6−9 experiments.
Figure 3
Figure 3
Effects of H2O2 on membrane currents of hepatocytes. (A) Amphotericin B-perforated whole-cell membrane currents induced by 10 mV-increasing and decreasing voltage-step pulses before (a) and during (b) application of 400 μmol/L H2O2. The holding potential was -20 mV (horizontal dashed line). Ac: Current-voltage relationships obtained from the data presented in (Aa,b) before (○) and during (•) application of H2O2. (B) Whole-cell membrane currents recorded using the conventional whole-cell method. The pipette solution contained 5 mmol/L ATP. Bc: Current-voltage relationships obtained from the data presented in (Ba,b) before (○) and during (•) application of H2O2. Representative traces from 5 experiments are shown in (A) and (B). bP<0.05, cP<0.01 before application of H2O2, respectively.
Figure 4
Figure 4
ATP-sensitive conductance in hepatocytes. (A) Under perforated-patch conditions with ATP-free pipette solution, step-pulse-induced currents (a) were enhanced by conversion (suction) to conventional whole-cell configuration (b,c). (B) Under whole-cell patch conditions with ATP-free pipette solution, step-pulse-induced currents were tested at 1 (a) and 5 (b) min after conversion to whole-cell conditions and showed an enhancement of membrane currents (c). (C) Inside-out patch recordings. Currents through the membrane in response to repeatedly applied voltage-ramp pulses from -90 to 90 mV are shown (a). Initially, the concentration of ATP in the bath solution was 1 mmol/L, and then ATP was removed and an ATP-free bath solution was used. Amiloride (1 mmol/L) was applied under ATP-free conditions. Representative traces from 5 experiments are shown. The magnitudes of currents were measured at 90 mV (b) and -90 mV (c) of the transmembrane potential. Each column represents the mean from 5 series of experiments. bP<0.05, cP<0.01.
Figure 5
Figure 5
Effects of melatonin on H2O2-induced membrane current enhancement. (A) Compared to control responses (a), melatonin alone did not enhance membrane currents (b), but pre-treatment of recorded cell with 10 μmol/L melatonin for 5 min prevented 400 μmol/L H2O2-induced membrane current enhancement (c). After washout for 5 min, 400 μmol/L H2O2 induced membrane current enhancement in the same cell (d). (B) Summary of data shown in (A). Each symbol represents the mean from 6 cells tested. bP<0.05 vs control.
Figure 6
Figure 6
Effects of amiloride on H2O2-induced changes in membrane conductance and [Ca2+]i. (A) Amphotericin B-perforated whole-cell currents recorded in the presence of 1 mmol/L amiloride before (a) and during (b) application of 400 μmol/L H2O2. Ac: Current-voltage relationships from the data (n=6) shown in (Aa,b) before (○) and during (•) application of H2O2. Ba: [Ca2+]i was measured in the presence of amiloride (100 μmol/L), and then 400 μmol/L H2O2 was applied. Bb: The concentration of amiloride was 1 mmol/L. Bc: Normalized [Ca2+]i from the data of 4−8 experiments shown in (Ba) and (Bb). Application of amiloride by itself caused a decrease in the Fura-2 intensity ratio. The change in the baseline level (Fura-2 intensity ratio) by amiloride seems to be due to some non-specific, direct reversible effect of amiloride on Fura-2 activity because both the appearance and disappearance of the effect are very quick. cP<0.01 vs Amiloride 0 mmol/L.
Figure 7
Figure 7
H2O2 impaired mitochondrial function. (A) Rh123 intensity changes induced by 1 mmol/L NaCN (dashed line) and 400 μmol/L H2O2 (bold line). (B) NAD(P)H intensity changes induced by 1 mmol/L NaCN (dashed line) and 400 μmol/L H2O2(bold line). (C) Summary of the effects of 1 mmol/L NaCN and 400 μmol/L H2O2 on NAD(P)H and Rh123. Baseline values were measured at the 2-min time point and the NaCN-induced and H2O2-induced responses were measured at the 4-min time point for Rh123 intensity and at the 8-min time point for NAD(P)H intensity. Representative columns from 13−33 cells tested. cP<0.01 vs baseline.
Figure 8
Figure 8
Role of the PLC pathway in H2O2-induced elevation of [Ca2+]i. (A) Hepatocytes were pre-treated with 1 μmol/L U73122 for 30 min and then stimulated with 1 mmol/L H2O2 in the presence of 1 mmol/L Ca2+. (B) Direct measurements of PLC activity during exposure to different concentrations of H2O2 showed that only 1 mmol/L H2O2 significantly increased PLC activity. Each column represents the average from 5 experiments and the vertical bars represent SD. cP<0.01 vs control.

Similar articles

Cited by

References

    1. Bzeizi KI, Dawkes R, Dodd NJ, Plevris JN, Hayes PC. Graft dysfunction following liver transplantation: role of free radicals. J Hepatol. 1997;26:69–74. - PubMed
    1. Jaeschke H. Mechanisms of liver injury. II. Mechanisms of neutrophil-induced liver cell injury during hepatic ischemia-reperfusion and other acute inflammatory conditions. Am J Physiol Gastrointest Liver Physiol. 2006;290:G1083–8. - PubMed
    1. Rosser BG, Gores GJ. Liver cell necrosis: cellular mechanisms and clinical implications. Gastroenterology. 1995;108:252–75. - PubMed
    1. Rychkov G, Brereton HM, Harland ML, Barritt GJ. Plasma membrane Ca2+ release-activated Ca2+ channels with a high selectivity for Ca2+ identified by patch-clamp recording in rat liver cells. Hepatology. 2001;33:938–47. - PubMed
    1. Hoffman JW, Jr, Gilbert TB, Poston RS, Silldorff EP. Myocardial reperfusion injury: etiology, mechanisms, and therapies. J Extra Corpor Technol. 2004;36:391–411. - PubMed

Publication types

MeSH terms