. 2008;3(12):e3928.
doi: 10.1371/journal.pone.0003928. Epub 2008 Dec 11.

Connectivity of the primate superior colliculus mapped by concurrent microstimulation and event-related FMRI

Affiliations

Connectivity of the primate superior colliculus mapped by concurrent microstimulation and event-related FMRI

Courtney B Field et al. PLoS One. 2008.

Abstract

Background: Neuroanatomical studies investigating the connectivity of brain areas have heretofore employed procedures in which chemical or viral tracers are injected into an area of interest, and connected areas are subsequently identified using histological techniques. Such experiments require the sacrifice of the animals and do not allow for subsequent electrophysiological studies in the same subjects, rendering a direct investigation of the functional properties of anatomically identified areas impossible.

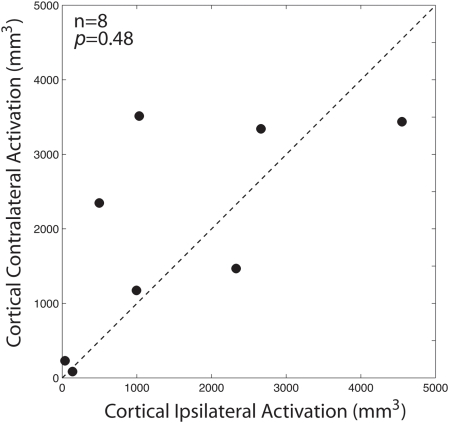
Methodology/principal findings: Here, we used a combination of microstimulation and fMRI in an anesthetized monkey preparation to study the connectivity of the superior colliculus (SC). Microstimulation of the SC resulted in changes in the blood oxygenation level-dependent (BOLD) signals in the SC and in several cortical and subcortical areas consistent with the known connectivity of the SC in primates.

Conclusions/significance: These findings demonstrates that the concurrent use of microstimulation and fMRI can be used to identify brain networks for further electrophysiological or fMRI investigation.


Conflict of interest statement

Competing Interests: The authors have declared that no competing interests exist.

Figures

Figure 1
Figure 1. Artifact created by the microelectrode.
T2* (a) - and T2-weighted images (b) show the extent of the artifact created by the microelectrode in the functional and anatomical images.
Figure 2
Figure 2. Activation maps and activation time courses for SC and FEF activated regions in subject m1 (session 1).
(a) SC activation map is superimposed on a parasaggital section of structural T2-weighted MRI (p<0.05, corrected for multiple comparisons). An increased BOLD signal in the SC at the tip of the electrode (dark artifact in the MRI, yellow arrow) evoked via microstimulation is clearly visible. (b) Coronal section at the level of the FEF with superimposed activation map ((p<0.05, corrected for multiple comparisons) from the same session. (c) Activation time courses for the SC (all activated voxels in a 28.6 mm3 volume at the tip of the microelectrode) and FEF (all activated voxels in a 112mm3 volume) from one 3 min run. Dashed lines indicate the time of 200 ms microstimulation.
Figure 3
Figure 3. Activation maps show similar BOLD activity in (a) FEF, SEF, and (b) LIP across subjects, m1 (session 2) and m2 (session 4), following caudal SC microstimulation.
Activation maps are superimposed on coronal sections of structural T2-weighted MRI (p<0.05, corrected for multiple comparisons). The anterior-posterior coordinates relative to the anterior commissure for each section are (a) 1 mm and 4 mm, and (b) -21 mm and -20 mm for subjects' m1 and m2, respectively.
Figure 4
Figure 4. Effect of caudal SC microstimulation on cortical and subcortical BOLD signals in subject m1 (session 1).
(a) Eye-position traces (filtered with a 30 Hz low-pass filter implemented in Matlab) evoked by microstimulation (40 µA) of caudal SC. 100 ms stimulation of the left SC produced 20° rightward saccades. Traces were obtained immediately before the microelectrode was glued in place. Activation maps (84 trials, six 3 min runs with 14 stimulations each) are superimposed on coronal (b) and parasaggital (c) sections of structural T2-weighted MRI (p<0.05, corrected for multiple comparisons). The numbers below each image indicate the anterior-posterior (A-P) coordinates (b) and the medial-lateral (M-L) coordinates (c) relative to the anterior commissure. Average BOLD signal time courses in response to the 200 ms current pulse train (84 trials, six 3 min runs with 14 stimulations each) for activated regions of interest localized in the coronal and parasaggital slices. Percentage BOLD signal change plotted by time in seconds (s). Error bars represent the standard error of the mean across trials. ACC, anterior cingulate cortex; DpMe, deep mesencephalic nucleus; Eh, horizontal eye position, FEF, frontal eye fields; LIP, lateral intraparietal region; M1, primary motor cortex; MST, medial superior temporal area; MT, middle temporal area; PCC, posterior cingulate cortex; PGOp, parietal area PG, opercular part; SC, superior colliculus; TPO, temporal parietooccipital associated area in sts; V2, visual area 2; V3A, visual area 3A.
Figure 5
Figure 5. Activation map across sessions in subject m1 (average of 12 3-minute stimulation runs) and subject m2 (average of 15 3-minute stimulation runs).
Activation maps are superimposed on parasaggital and coronal sections of structural T2-weighted MRI (p<0.05, corrected for multiple comparisons). The numbers below the images indicate the medial-lateral (M-L) coordinates (parasaggital slices) and anterior-posterior (A-P) coordinates (coronal slices) relative to the anterior commissure for each subject. FEF, frontal eye fields; LIP, lateral intraparietal region; SC, superior colliculus.
Figure 6
Figure 6. FEF and LIP 3D BOLD activation after caudal SC microstimulation in subject m1 (session 1).
Functional activation map (p<0.05) is rendered on the subject's brain segmented at the grey/white matter boundary.
Figure 7
Figure 7. Effect of SC microstimulation on cortical activation.
The total volume of cortical activation in the hemisphere ipsilateral to the SC stimulation site (abscissa) is plotted against the cortical activation in the hemisphere contralateral to the stimulation site (ordinate). Each dot represents the cortical activation for one microstimulation site. The dashed line represents the unity line (slope = 1).
Figure 8
Figure 8. Effect of stimulation frequency on BOLD signal changes in subject m1 (session 1).
(a) Average BOLD signal time course (84 trials, six 3 min runs with 14 stimulations each) in response to 300Hz current pulse trains (red) and 150Hz current pulse trains (blue) in the stimulated caudal SC. (b) Same as (a) for FEF. Percentage BOLD signal change plotted by time in seconds (s). Error bars represent the standard error of the mean across trials.

Similar articles

Cited by

References

    1. Ungerleider LG, Desimone R. Cortical connections of visual area MT in the macaque. JComp Neurol. 1986;248:190. - PubMed
    1. Leichnetz GR, Spencer RF, Hardy SG, Astruc J. The prefrontal corticotectal projection in the monkey; an anterograde and retrograde horseradish peroxidase study. Neuroscience. 1981;6:1023. - PubMed
    1. Felleman DJ, Van Essen DC. Distributed hierarchical processing in the primate cerebral cortex. CerebCortex. 1991;1:1. - PubMed
    1. Boldogkoi Z, Sik A, Denes A, Reichart A, Toldi J, et al. Novel tracing paradigms–genetically engineered herpesviruses as tools for mapping functional circuits within the CNS: present status and future prospects. Prog Neurobiol. 2004;72:417–445. - PubMed
    1. Kobbert C, Apps R, Bechmann I, Lanciego JL, Mey J, et al. Current concepts in neuroanatomical tracing. Prog Neurobiol. 2000;62:327–351. - PubMed

Publication types