. 2008 Dec;4(12):e1000239.
doi: 10.1371/journal.pcbi.1000239. Epub 2008 Dec 12.

Encoding of naturalistic stimuli by local field potential spectra in networks of excitatory and inhibitory neurons

Affiliations

Encoding of naturalistic stimuli by local field potential spectra in networks of excitatory and inhibitory neurons

Alberto Mazzoni et al. PLoS Comput Biol. 2008 Dec.

Abstract

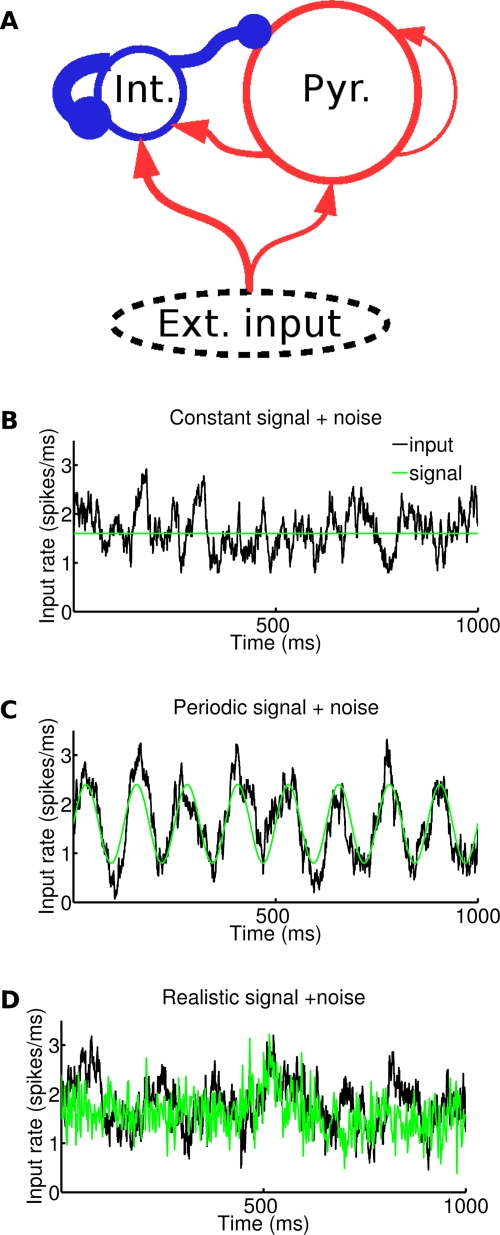
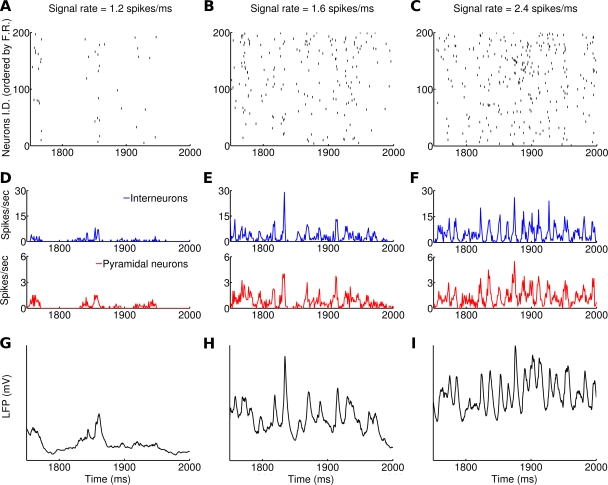
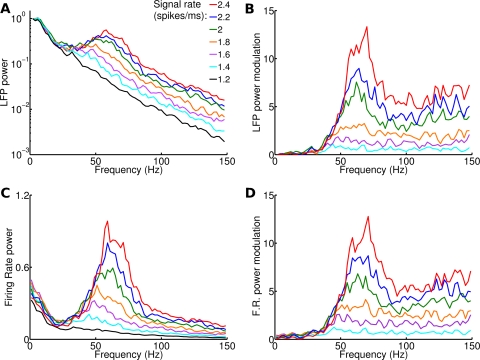
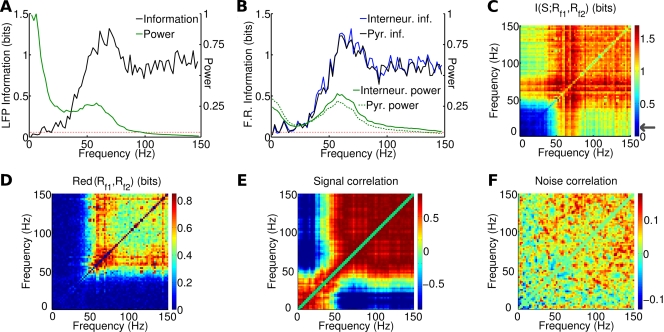
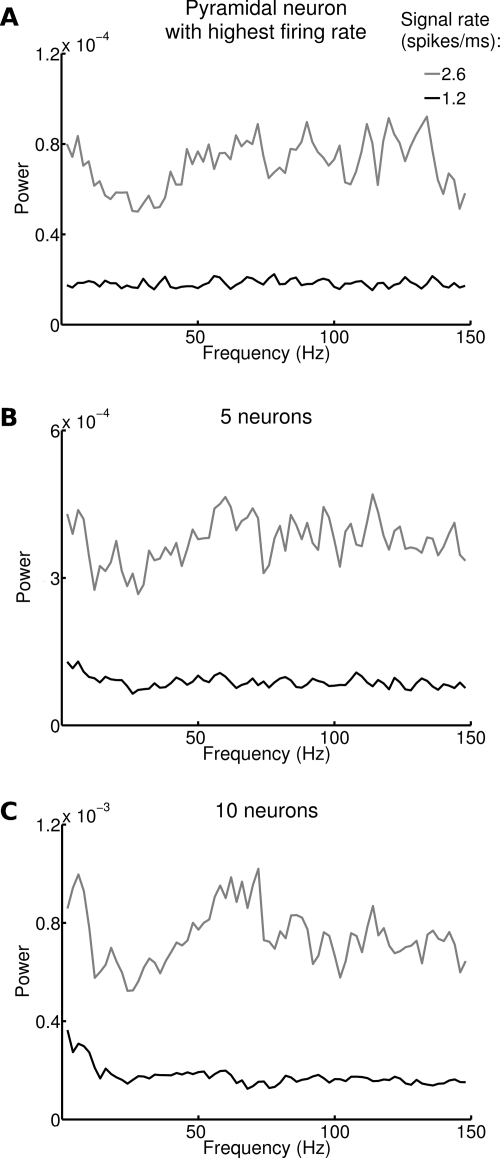
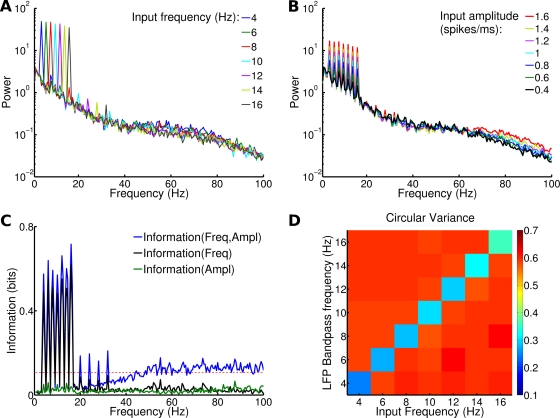
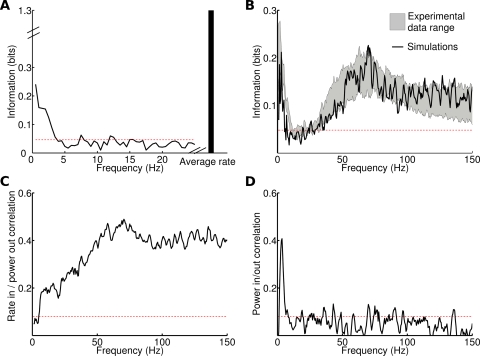
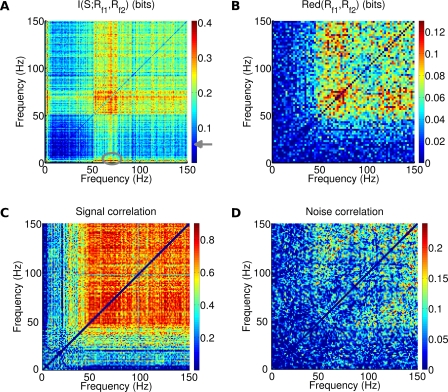
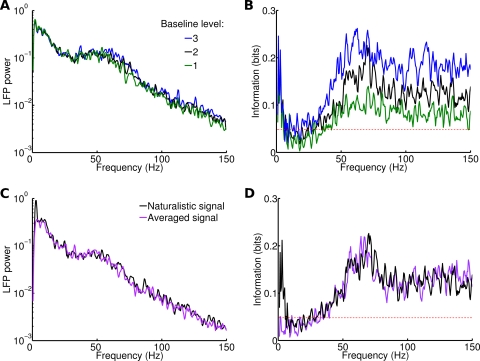
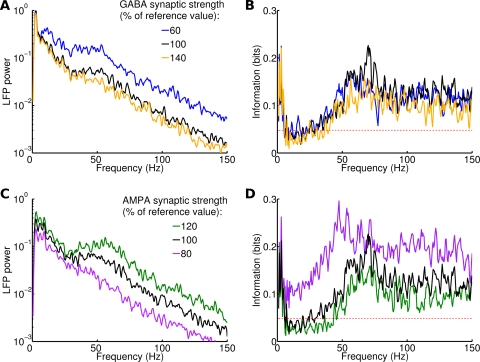
Recordings of local field potentials (LFPs) reveal that the sensory cortex displays rhythmic activity and fluctuations over a wide range of frequencies and amplitudes. Yet, the role of this kind of activity in encoding sensory information remains largely unknown. To understand the rules of translation between the structure of sensory stimuli and the fluctuations of cortical responses, we simulated a sparsely connected network of excitatory and inhibitory neurons modeling a local cortical population, and we determined how the LFPs generated by the network encode information about input stimuli. We first considered simple static and periodic stimuli and then naturalistic input stimuli based on electrophysiological recordings from the thalamus of anesthetized monkeys watching natural movie scenes. We found that the simulated network produced stimulus-related LFP changes that were in striking agreement with the LFPs obtained from the primary visual cortex. Moreover, our results demonstrate that the network encoded static input spike rates into gamma-range oscillations generated by inhibitory-excitatory neural interactions and encoded slow dynamic features of the input into slow LFP fluctuations mediated by stimulus-neural interactions. The model cortical network processed dynamic stimuli with naturalistic temporal structure by using low and high response frequencies as independent communication channels, again in agreement with recent reports from visual cortex responses to naturalistic movies. One potential function of this frequency decomposition into independent information channels operated by the cortical network may be that of enhancing the capacity of the cortical column to encode our complex sensory environment.


Conflict of interest statement

The authors have declared that no competing interests exist.

Figures

Figure 1
Figure 1. Network structure and inputs.
(A) The network is composed of two populations (1000 interneurons and 4000 pyramidal neurons). The connectivity is random, a synapse being present between any directed pair of neurons with probability 0.2. The size of the arrows represents schematically the strength of single synapses: recurrent interactions are dominated by inhibition. In addition to recurrent interactions, both populations receive an external excitatory input. (B–D) Three types of inputs are delivered to the network. The three panels display (in black) the time-varying rate of Poissonian spike trains representing external inputs to each neuron in the network in a 1 second long interval. All inputs are a superposition of a ‘signal’ and a ‘noise’ component. The ‘signal’ is shown in green. Average value of input is 1.6 spikes/ms in all traces. The noise is modelled as an Ornstein-Uhlenbeck process (see Methods) in all cases while the three signals are different, (B) Signal: constant rate. (C) Signal: oscillatory rate (here shown with 8 Hz frequency and 0.8 spikes/ms amplitude) (D) Signal: taken from MUA recordings of LGN of anesthetized monkeys watching natural movie scenes (see Methods).
Figure 2
Figure 2. Dynamics of the network receiving a constant signal, with three different rates (left, middle, right column: 1.2, 1.6, 2.4 spikes/ms), superimposed to noise.
In each column, all panels show the same 250 ms interval (extracted from a 2 seconds simulation). (A–C) Raster plot of the activity of 200 pyramidal neurons (those that had the highest firing rate during the simulation). (D–F) Average instantaneous firing rate (computed on a 1 ms bin) of interneurons (blue, upper panels) and pyramidal neurons (red, lower panels). Notice the difference in scale. (G–I) LFP of the network, modeled as the sum of the absolute values of AMPA and GABA currents on pyramidal neurons (see Methods). Notice that the population oscillations become more pronounced as the rate of the signal increased, while oscillations are not detectable at the single neuron level.
Figure 3
Figure 3. LFP and firing rate power spectrum as a function of signal rate.
Each stimulus was composed of a constant signal with a given rate (indicated in the legend) plus noise. Power spectra are averaged from 20 trials of 2 seconds each with different noise realizations. Color code is the same for all panels. (A) LFP power spectrum for various signal rates. (B) Modulation of LFP spectrum for various signal rates. Modulation is defined as the difference of the power of a frequency at a given signal rate and its power at 1.2 spikes/ms signal rate, normalized to the latter power. Compare with Figures 2 and 4 of (C–D) Same as (A–B) for firing rate spectrum. Notice the difference in scale between (A) and (C).
Figure 4
Figure 4. Information content of LFP and firing rate power spectrum relative to constant stimuli with different rates.
Each stimulus was composed by noise plus a constant signal with a rate ranging from 1.2 to 2.6 spikes/ms, and presented 20 times for 2 seconds with different noise realizations. (A) Information content of LFP spectrum (in black). The power spectrum averaged over all signals and trials is displayed in a linear scale with arbitrary units for comparison (in green). Red dashed line corresponds to significance threshold (p<0.05; bootstrap test) for information. (B) Information content of the spectrum of the pyramidal (black) and interneurons (blue) population firing rates. Power spectra are displayed with dashed and continuous green line, respectively. Red dashed line as in (A). (C–F) Analysis of LFP frequency pairs: (C) joint information, i.e. information obtained by considering the two frequencies of the pair (see Equation 13). The gray arrow in the color scale indicates significance threshold (p<0.05, bootstrap test). (D) Redundancy, i.e. the difference between the sum of the two information contents and the joint information. (E) Signal correlation, i.e. the correlation across stimuli of trial averaged responses. (F) Noise correlation, i.e. the correlation for fixed stimulus of fluctuations across trials.
Figure 5
Figure 5. Spectral modulations associated to changes in stimulus rate in ensembles of a small number of neurons.
(A) Power spectrum of firing of pyramidal neuron with highest firing rate when the signal rate is 1.2 and 2.6 spikes/ms. Averages over 20 trials displayed in black and gray, respectively. (B–C) Same as (A) for the total firing rate of the 5 and 10 pyramidal neurons with highest firing rates, respectively. Notice the difference in the power scale.
Figure 6
Figure 6. Modulations in the power spectrum of LFP due to changes in the spectral content of the input.
Each stimulus was composed by noise plus a periodic signal. Signal amplitude A varied from 0.4 to 1.6 spikes/ms and signal frequency ω from 4 to 16 Hz. Modulations were studied (i) across the whole range of stimuli, (ii) pooling together all the responses to stimuli with the same frequency, (iii) pooling together all the responses to stimuli with the same amplitude. (A) LFP power spectra across set (ii). Data are averaged over 20 trials and over the set of amplitudes. (B) LFP power spectra across set iii). Data shown are averaged over 20 trials and over the set of frequencies. (C) Information associated to changes in stimulus spectral content. Information relative to set (i), (ii) and (iii) is respectively displayed in blue, black and green. Red dashed line corresponds to significance threshold (p<0.05; bootstrap test) for information. (D) Circular variance of phase difference between the input signal and the LFP bandpassed at different frequencies (with a 2 Hz range). The circular variance was averaged over all trials and amplitudes.
Figure 7
Figure 7. Information content relative to naturalistic stimuli, based on MUA recordings from LGN of an anesthetized monkey watching natural movie scenes.
Recording time (40 seconds) was divided into 20 intervals, considered as different signals. Each signal was injected 20 times with different noise realizations (see Methods). Red dashed horizontal line indicates significance threshold (p<0.05; bootstrap test) in all panels. (A) Information content of different frequencies and average rate of naturalistic input. (B) Information content, relative to naturalistic inputs, of simulated LFP (in black) compared with the information content of LFP recorded in V1 in the same experiment from which LGN data were taken. Gray area represents the mean±std range of information across 7 different electrodes recording synchronously from different sites. (C–D) Correlation between LFP spectrum and signal features. (C) Correlation between stimulus rate and power of LFP frequencies in the response. (D) Correlation between the power of each frequency in the stimulus spectrum, and its power in the corresponding LFP spectrum.
Figure 8
Figure 8. Frequency correlations in LFP when network was presented with naturalistic stimuli.
(A) Joint information for frequency pairs. The ellipse indicates the maximum value, obtained for pairs composed by a frequency <5 Hz and gamma band frequencies. The arrow indicates significance threshold (p<0.05, bootstrap test). (B–D) Values of (B) Redundancy, (C) Signal correlation, (D) Noise correlation, for frequency pairs in the LFP spectrum. Measures were computed for frequencies set at least 2 Hz apart.
Figure 9
Figure 9. Effects of modulations of naturalistic stimuli.
(A) Power spectrum of LFP during a single stimulus, for three different levels of baseline of the same signal. Results averaged over 20 trials. (B) Information content of LFP spectrum for three different levels of baseline for the whole input. Same color code as (A). Red dashed line corresponds to significance threshold (p<0.05; bootstrap test) for information. (C) Power spectrum of LFP during a single stimulus with a naturalistic signal (in black) and with the same signal averaged (in purple). Results averaged over 20 trials. The stimulus selected is different from the one in (A). (D) Information contained in the LFP spectrum relative to naturalistic signals and averaged signals. Same color code as (C). Red dashed line same as (B).
Figure 10
Figure 10. Effects of modulations in GABA and AMPA synaptic strength when naturalistic stimuli are injected.
(A) Power spectrum of LFP for a single stimulus and different values of GABA strength, measured as percentage of the reference strength displayed in Table 2. Results are averaged over 20 trials. (B) Information contained in the LFP spectrum for the three synaptic strengths. Red dashed line corresponds to significance threshold (p<0.05; bootstrap test) for information. Same color code as (A). (C–D) Same as (A–B) for AMPA strength modulations.

Similar articles

Cited by

References

    1. Neville KR, Haberly LB. Beta and gamma oscillations in the olfactory system of the urethane-anesthetized rat. J Neurophysiol. 2003;90:3921–3930. - PubMed
    1. Brosch M, Budinger E, Scheich H. Stimulus-related gamma oscillations in primate auditory cortex. J Neurophysiol. 2002;87:2715–2725. - PubMed
    1. Kayser C, Petkov CI, Logothetis NK. Tuning to sound frequency in auditory field potentials. J Neurophysiol. 2007;98:1806–1809. - PubMed
    1. Gray CM, Konig P, Engel AK, Singer W. Oscillatory responses in cat visual cortex exhibit inter-columnar synchronization which reflects global stimulus properties. Nature. 1989;338:334–337. - PubMed
    1. Rols G, Tallon-Baudry C, Girard P, Bertrand O, Bullier J. Cortical mapping of gamma oscillations in areas V1 and V4 of the macaque monkey. Vis Neurosci. 2001;18:527–540. - PubMed

Publication types