. 2008 Dec;4(12):e1000303.
doi: 10.1371/journal.pgen.1000303. Epub 2008 Dec 12.

The repertoire and dynamics of evolutionary adaptations to controlled nutrient-limited environments in yeast

Affiliations

The repertoire and dynamics of evolutionary adaptations to controlled nutrient-limited environments in yeast

David Gresham et al. PLoS Genet. 2008 Dec.

Abstract

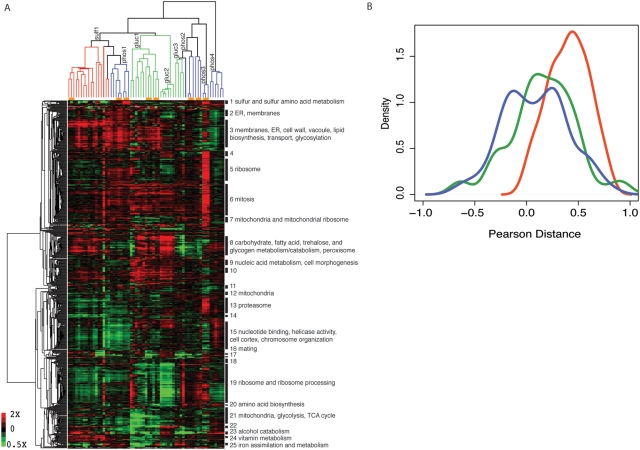
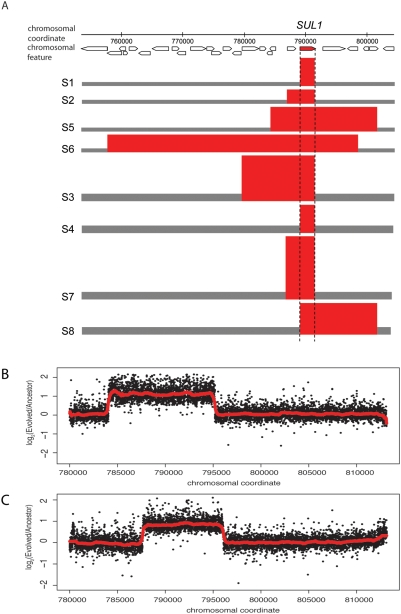
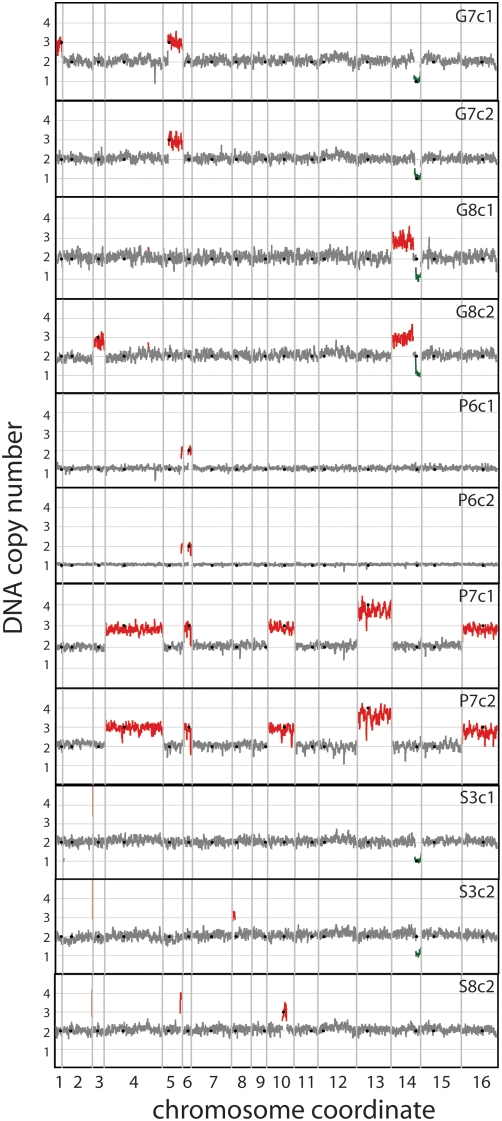
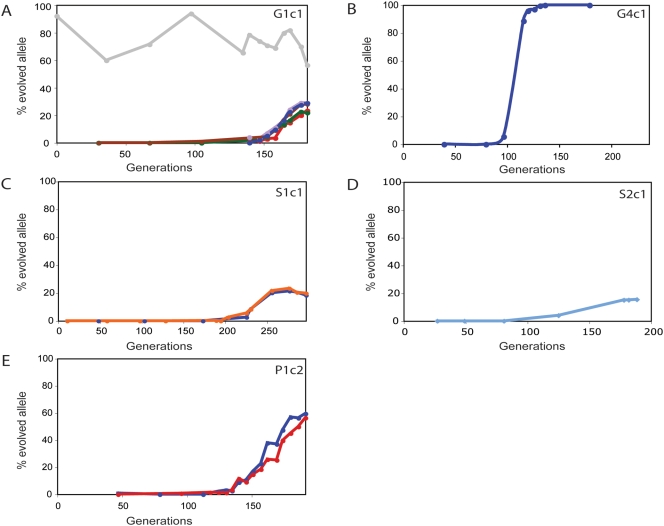
The experimental evolution of laboratory populations of microbes provides an opportunity to observe the evolutionary dynamics of adaptation in real time. Until very recently, however, such studies have been limited by our inability to systematically find mutations in evolved organisms. We overcome this limitation by using a variety of DNA microarray-based techniques to characterize genetic changes -- including point mutations, structural changes, and insertion variation -- that resulted from the experimental adaptation of 24 haploid and diploid cultures of Saccharomyces cerevisiae to growth in either glucose, sulfate, or phosphate-limited chemostats for approximately 200 generations. We identified frequent genomic amplifications and rearrangements as well as novel retrotransposition events associated with adaptation. Global nucleotide variation detection in ten clonal isolates identified 32 point mutations. On the basis of mutation frequencies, we infer that these mutations and the subsequent dynamics of adaptation are determined by the batch phase of growth prior to initiation of the continuous phase in the chemostat. We relate these genotypic changes to phenotypic outcomes, namely global patterns of gene expression, and to increases in fitness by 5-50%. We found that the spectrum of available mutations in glucose- or phosphate-limited environments combined with the batch phase population dynamics early in our experiments allowed several distinct genotypic and phenotypic evolutionary pathways in response to these nutrient limitations. By contrast, sulfate-limited populations were much more constrained in both genotypic and phenotypic outcomes. Thus, the reproducibility of evolution varies with specific selective pressures, reflecting the constraints inherent in the system-level organization of metabolic processes in the cell. We were able to relate some of the observed adaptive mutations (e.g., transporter gene amplifications) to known features of the relevant metabolic pathways, but many of the mutations pointed to genes not previously associated with the relevant physiology. Thus, in addition to answering basic mechanistic questions about evolutionary mechanisms, our work suggests that experimental evolution can also shed light on the function and regulation of individual metabolic pathways.


Conflict of interest statement

The authors have declared that no competing interests exist.

Figures

Figure 1
Figure 1. Adaptation to nutrient-limitation results in massive remodeling of global gene expression
. (A) Gene expression data, presented as the log2-transformed ratio of each gene's expression value in the evolved versus ancestral strain, were hierarchically clustered on both axes (y-axis, 5443 genes; x-axis, 48 clone and 15 population samples). The dendrogram for the clustered experiments (x-axis) is color-coded by nutrient limitation (sulfate-limitation in red, glucose-limitation in green, and phosphate-limitation in blue). Orange horizontal bars represent groupings where the two clones and their corresponding population sample are more correlated with each other than with any other experiments. Glucose expression states fall into three phenoclusters (Gluc1, Gluc2, Gluc3) while phosphate expression states fall into four (Phos1, Phos2, Phos3, Phos4). (B) Density estimates of the distribution of pairwise pearson correlations (N = 112) of the expression states of clones selected under three different nutrient limitations. Clonal isolates from independent sulfate-limitation evolutions (red) were more similar to each other (median pearson distance = 0.425) than those obtained from independent glucose (green, median pearson distance = 0.152) or phosphate (blue, median pearson distance = 0.088) evolutions. The three distributions were compared using the Wilcoxon-Mann-Whitney rank-sum test. The distributions of pairwise correlations between sulfate and glucose clones are significantly different (U = 3097, p-value = 5.9×10⁻¹¹) as are the distributions between sulfate and phosphate clones (U = 2545, p-value = 1.54×10⁻¹⁴). The distributions of pairwise distances between phosphate and glucose clones are not significantly different (U = 7103, p-value = 0.08681).
Figure 2
Figure 2. SUL1 is amplified in multiple independent evolutions.
(A) Amplified fragments that include the gene SUL1 were identified in clones recovered from all sulfate evolutions. Amplicons, in red, span the length of the CGH signal deviation from wildtype ploidy (in gray). The height of the amplicon reflects the copy number relative to wildtype (gray bars, height scaled to haploid or diploid copy number as appropriate). The number of copies of amplified fragments was determined by averaging CGH data from two clones from each population, with the exception of populations S1 and S2, in which only one clone was used due to disagreement between the clones. We analyzed two of these amplicons in further detail using a high density overlapping tiling microarray. The breakpoints for SUL1 amplifications were precisely mapped in the haploid clone S2c1 (B) and the diploid clone S4c1 (C). Complete data are shown for the ratio between independent hybridizations of evolved and ancestral DNA for the 7356 probes that span chromosomal coordinates 780003-813512 of chromosome II. A running median was computed using the R function runmed with a median window width of 201 (red line).
Figure 3
Figure 3. Structural genomic variation is detected in clones selected from all long-term nutrient limitations.
We computed a running average of log2 ratios between evolved and ancestral genomes determined using CGH across 7 consecutive genes. Contiguous regions deviating from wildtype ploidy levels are colored red for amplifications and green for deletions. Regions that did not deviate from wildtype copy number are in gray. Centromeres of each of the 16 chromosomes are indicated by black dots.
Figure 4
Figure 4. Dynamics of allele frequencies in evolving populations.
We determined allele frequencies for SNPs identified at detectable frequencies in the final population sample using quantitative sequencing. (A) clone G1c1 (red, MMS2; purple, SAP185; green, GIN4; brown, BRR2; blue, CCR4; gray, PTH2), (B) clone G4c1 (blue, GSH1), (C) clone S1c1 (blue, ERG1; orange, SGF73), (D) clone S2c1 (blue, SGF73) and (E) clone P1c2 (blue, CKA2; red, SIR1). We computed fitness coefficients for clones using allele frequency estimates as estimates of clone frequencies. Fitness coefficients were calculated for each allele (Table 5) and for each clone as described in methods. Relative selection coefficients of clones are (mean±95%CI): clone G1c1 = 1.0918±0.0159, clone S1c1 = 1.0361±0.0139, clone S2c1 = 1.0247±0.0975, clone P1c2 = 1.0602±0.0081. A selection coefficient for the diploid clone G4c1 could not be computed due to the atypical allelic profile of the GSH1 mutation.

Similar articles

Cited by

References

    1. Luria SE, Delbrück M. Mutations of Bacteria from Virus Sensitivity to Virus Resistance. Genetics. 1943;28:491–511. - PMC - PubMed
    1. Holder KK, Bull JJ. Profiles of adaptation in two similar viruses. Genetics. 2001;159:1393–1404. - PMC - PubMed
    1. Bollback JP, Huelsenbeck JP. Clonal interference is alleviated by high mutation rates in large populations. Mol Biol Evol. 2007;24:1397–1406. - PubMed
    1. Velicer GJ, Raddatz G, Keller H, Deiss S, Lanz C, et al. Comprehensive mutation identification in an evolved bacterial cooperator and its cheating ancestor. Proc Natl Acad Sci U S A. 2006;103:8107–8112. - PMC - PubMed
    1. Herring CD, Raghunathan A, Honisch C, Patel T, Applebee MK, et al. Comparative genome sequencing of Escherichia coli allows observation of bacterial evolution on a laboratory timescale. Nat Genet. 2006;38:1406–1412. - PubMed

Publication types

MeSH terms

Associated data