. 2008;3(12):e3944.
doi: 10.1371/journal.pone.0003944. Epub 2008 Dec 15.

mKikGR, a monomeric photoswitchable fluorescent protein

Affiliations

mKikGR, a monomeric photoswitchable fluorescent protein

Satoshi Habuchi et al. PLoS One. 2008.

Abstract

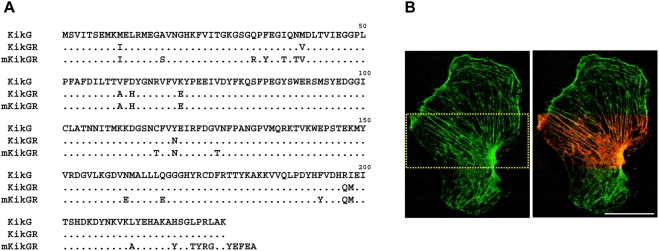
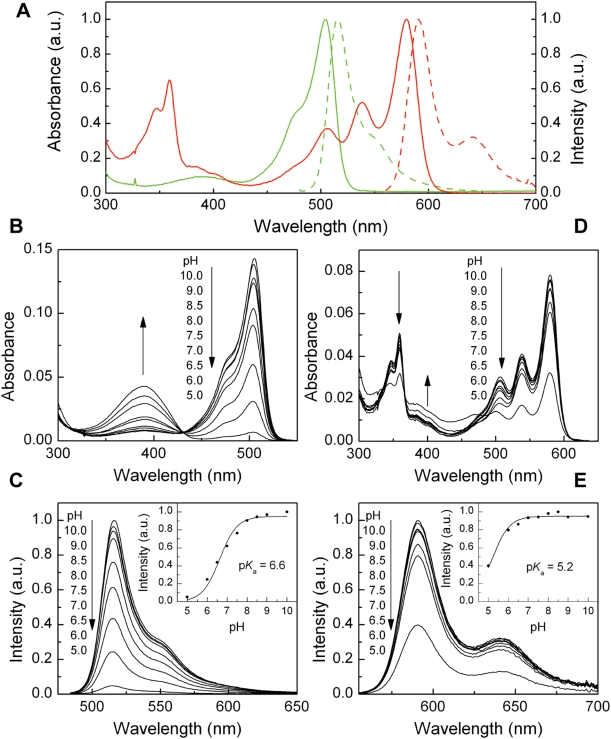
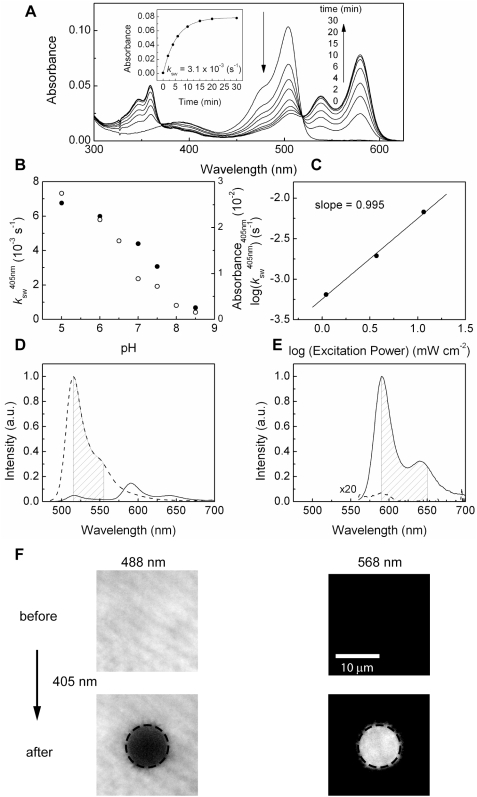
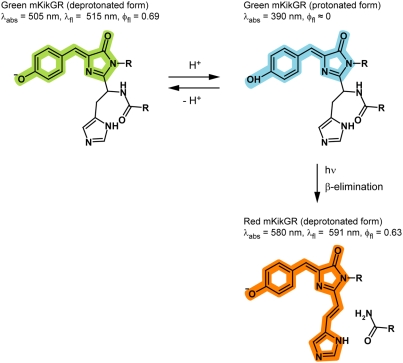
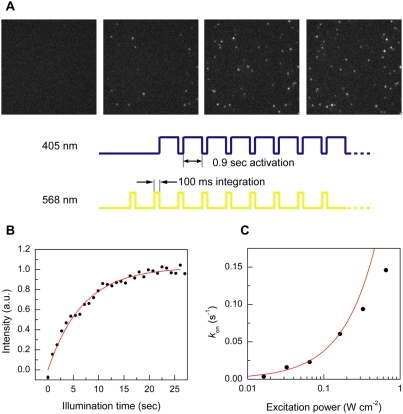
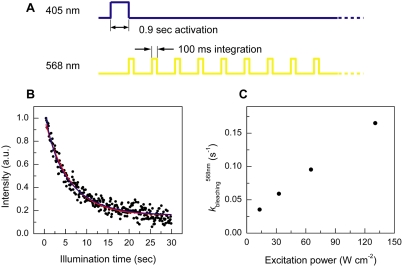
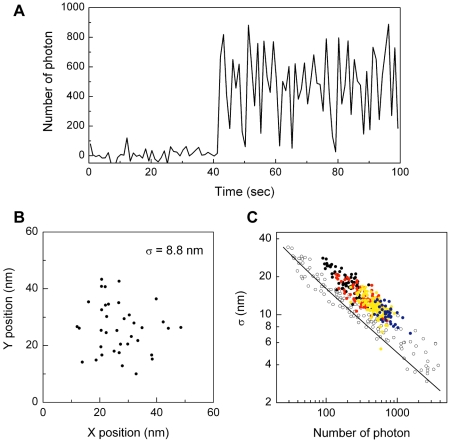
The recent demonstration and utilization of fluorescent proteins whose fluorescence can be switched on and off has greatly expanded the toolkit of molecular and cell biology. These photoswitchable proteins have facilitated the characterization of specifically tagged molecular species in the cell and have enabled fluorescence imaging of intracellular structures with a resolution far below the classical diffraction limit of light. Applications are limited, however, by the fast photobleaching, slow photoswitching, and oligomerization typical for photoswitchable proteins currently available. Here, we report the molecular cloning and spectroscopic characterization of mKikGR, a monomeric version of the previously reported KikGR that displays high photostability and switching rates. Furthermore, we present single-molecule imaging experiments that demonstrate that individual mKikGR proteins can be localized with a precision of better than 10 nanometers, suggesting their suitability for super-resolution imaging.


Conflict of interest statement

Competing Interests: The authors have declared that no competing interests exist.

Figures

Figure 1
Figure 1. Construction of mKikGR.
(A) Amino-acid sequences for KikG, KikGR, and mKikGR. (B) Rat primary astrocyte expressing mKikGR-βactin. Images show before (left) and after (right) local photoswitching by irradiating 405 nm laser over the yellow-boxed region. Cells are cultured at 37°C.
Figure 2
Figure 2. Spectroscopic properties of the green and red form of mKikGR.
(A) Normalized absorption (solid line) and fluorescence (dashed line) spectra of the green mKikGR (4.7 µM, green line) and red mKikGR (4.7 µM, red line). The red mKikGR was obtained by illuminating at 405 nm (12 mW cm−2) for 90 minutes. Fluorescence spectra of the green and red mKikGR were measured with 475 nm and 555 nm excitation, respectively. All measurements were performed at pH 8.0. (B, D) pH dependence of absorption spectra of the green (B) and red (D) mKikGR (4.7 µM). (C, E) pH dependence of fluorescence spectra of the green (C) and red (E) mKikGR (4.7 µM). Fluorescence spectra of the green and red mKikGR were measured with 475 nm and 555 nm excitation, respectively. (Inset) Peak fluorescence intensities at different pH. The solid lines show fitting with the Henderson-Hasselbalch equation.
Figure 3
Figure 3. Kinetics of photoswitching from the green to red mKikGR.
(A) Time course of the absorption spectra of mKikGR (4.7 µM, pH 7.5) on illumination at 405 nm (12 mW cm−2). (Inset) Time course of the peak absorbance of the red mKikGR (580 nm). The solid line shows the fitting with a first-order kinetic model. (B) pH dependence of the rate of the photoswitching (solid circles, left axis) and absorbance at 405 nm (open circles, right axis). (C) Excitation power dependence of the photoswitching. The rates were determined at pH 5.0. (D, E) Fluorescence spectra of mKikGR before (dashed lines) and after (solid lines) photoswitching. The spectra were measured with 475 nm (D) excitation and 555 nm (E) excitation. (F) The top panels show fluorescence images of the green (left) and red (right) mKikGR embedded in the thin film of polyacrylamide gel (10 µM, pH 7.0). The wavelength regions that emission filters transmit are indicated by shadow in Fig. 2D (green) and 2E (red). The region indicated by circle was illuminated with 405 nm light (1 sec, 6.3 W cm−2). The bottom panels show fluorescence images of the green (left) and red (right) mKikGR.
Figure 4
Figure 4. Reaction scheme of the photoswitching from the green to red mKikGR.
Figure 5
Figure 5. Photoswitching of mKikGR at the single-molecule level.
(A) Fluorescence images of individual red mKikGR molecules embedded in polyacrylamide gel (100 pM, pH 7.0). The images were recorded with 568 nm excitation (130 W cm−2, 100 ms integration, 1 Hz). The sample was illuminated with 405 nm light (33 mW cm−2) between 568 nm pulses. The images were recorded after 0, 1.8, 8.1, and 22 seconds total illumination time with 405 nm light. (B) Time course of integrated intensities of the images. The solid line shows fitting with a first order kinetic model. (C) Excitation power dependence of the photoswitching rates determined from the single-molecule measurements. The solid line shows theoretical switching rate calculated from bulk experiments.
Figure 6
Figure 6. Single-molecule photobleaching of mKikGR.
(A) Schematic illustration of experimental configuration. The excitation power of the 405 nm and 568 nm lights were set at 6.3 and 130 W cm−2, respectively. (B) Time course of the fluorescence intensity of the red mKikGR embedded in polyacrylamide gel (100 pM, pH 7.0). The red and blue lines show a single- and double-exponential fit. (C) Excitation power dependence of the photobleaching rates of the red mKikGR.
Figure 7
Figure 7. Localization accuracy obtained from mKikGR molecules.
(A) Fluorescence intensity trajectory of a single mKikGR molecule. The trajectory was constructed from single-molecule images of the red mKikGR (100 ms integration, 1 Hz). (B) Centroid positions obtained from single-molecule images of the red mKikGR. (C) Relationship between the localization accuracy and the total number of photons obtained from individual red mKikGR molecules (circle). The images were recorded with 568 nm excitation at the power of 13 (black circle), 33 (red circle), 65 (yellow circle), and 130 (blue circle) W cm−2. The open circle shows the relationship between the localization accuracy and the total number of photons obtained from individual qdots. The solid line shows theoretically calculated localization accuracy using equation 1.

References

    1. Tsien RY. The green fluorescent protein. Annual Review of Biochemistry. 1998;67:509–544. - PubMed
    1. Zhang J, Campbell RE, Ting AY, Tsien RY. Creating new fluorescent probes for cell biology. Nature Reviews Molecular Cell Biology. 2002;3:906–918. - PubMed
    1. Miyawaki A, Sawano A, Kogure T. Lighting up cells: labelling proteins with fluorophores. Nature Cell Biology. 2003:S1–S7. - PubMed
    1. Chudakov DM, Lukyanov S, Lukyanov KA. Fluorescent proteins as a toolkit for in vivo imaging. Trends in Biotechnology. 2005;23:605–613. - PubMed
    1. Ando R, Hama H, Yamamoto-Hino M, Mizuno H, Miyawaki A. An optical marker based on the UV-induced green-to-red photoconversion of a fluorescent protein. Proceedings of the National Academy of Sciences of the United States of America. 2002;99:12651–12656. - PMC - PubMed

Publication types