. 2008;3(12):e3927.
doi: 10.1371/journal.pone.0003927. Epub 2008 Dec 12.

Haploinsufficiency of activation-induced deaminase for antibody diversification and chromosome translocations both in vitro and in vivo

Affiliations

Haploinsufficiency of activation-induced deaminase for antibody diversification and chromosome translocations both in vitro and in vivo

Isora V Sernández et al. PLoS One. 2008.

Abstract

The humoral immune response critically relies on the secondary diversification of antibodies. This diversification takes places through somatic remodelling of the antibody genes by two molecular mechanisms, Class Switch Recombination (CSR) and Somatic Hypermutation (SHM). The enzyme Activation Induced Cytidine Deaminase (AID) initiates both SHM and CSR by deaminating cytosine residues on the DNA of immunoglobulin genes. While crucial for immunity, AID-catalysed deamination is also the triggering event for the generation of lymphomagenic chromosome translocations. To address whether restricting the levels of AID expression in vivo contributes to the regulation of its function, we analysed mice harbouring a single copy of the AID gene (AID(+/-)). AID(+/-) mice express roughly 50% of normal AID levels, and display a mild hyperplasia, reminiscent of AID deficient mice and humans. Moreover, we found that AID(+/-) cells have an impaired competence for CSR and SHM, which indicates that AID gene dose is limiting for its physiologic function. We next evaluated the impact of AID reduction in AID(+/-) mice on the generation of chromosome translocations. Our results show that the frequency of AID-promoted c-myc/IgH translocations is reduced in AID(+/-) mice, both in vivo and in vitro. Therefore, AID is haploinsufficient for antibody diversification and chromosome translocations. These findings suggest that limiting the physiologic levels of AID expression can be a regulatory mechanism that ensures an optimal balance between immune proficiency and genome integrity.


Conflict of interest statement

Competing Interests: The authors have declared that no competing interests exist.

Figures

Figure 1
Figure 1. AID is haploinsufficient for CSR.
(A) AID levels are reduced in AID+/− mice. Spleen B cells from AID+/+, AID+/− and AID−/− were stimulated for 3 days in the presence of LPS and IL4. RNA was isolated and AID expression was assessed by real-time RT-PCR. Bars represent AID mRNA expression relative to AID+/+ B cells. Statistical error bars show standard deviation (n = 5). ND, non-detectable. (B) AID+/− spleens contain increased numbers of B cells. Bars represent the number of spleen B cells (CD43 negative) and statistical bars represent standard deviations. n (AID+/+) = 18, n (AID+/−) = 16 and n (AID−/−) = 9. t test p (AID+/+ vs AID+/) = 6×10⁻⁴. (C) Peyer's patch B cells from AID+/− mice contain intermediate Fas+GL7+ cell numbers. Spleen B cells from AID+/+, AID+/− and AID−/− were stained with anti-Fas and anti-GL7 antibodies and analysed by flow cytometry. Percentage of Fas+GL7+ cells is indicated. One representative experiment is shown (n = 3). (D) ELISA quantification of IgG serum levels in AID+/+ (n = 5), AID+/− (n = 5) and AID−/− (n = 3) mice 15 days after NP-CGG (black bars) or PBS (white bars) injection. Statistical bars represent standard deviations. (E) CSR efficiency is reduced in AID+/− B cells. Spleen B cells from AID+/+, AID+/− and AID−/− were stimulated for 3 days in the presence of LPS and IL4. CSR to IgG1 was measured by flow cytometry. Representative plots of CFSE labelling and IgG1 expression are shown. Percentage of IgG1+ cells is indicated. (F) Time-course analysis of CSR. B cells from AID+/+, AID+/− and AID−/− were stimulated for the indicated times (X axis) in the presence of LPS and IL4. Percentage of IgG1+ as measured by flow cytometry is represented (Y axis). Statistical bars show standard deviations. p values (AID+/− vs AID+/+) for IgG1: 48h, 0.04; 72h, 0.03; 96h, 6×10⁻³; 120h, 3×10⁻³; for IgG3: 48h, 0.1; 72h, 8×10⁻³; 96h, 0.02; 120h, 0.02 (unpaired two-tailed Student's t test, n = 9). (G–H) AID overexpression increases CSR. Spleen B cells from AID+/+ mice were transduced with retroviral vectors encoding wild type (AID) or a catalitically inactive (AIDE58Q) AID along with GFP to monitor transduction. CSR to IgG1 was measured by flow cytometry 2 days after transduction. (G) A representative flow cytometry plot is shown in panel G. Percentages of IgG1+ cells within the GFP+ population are shown. (H) Percentage of IgG1+ cells within AID or AIDE58Q GFP+ cells determined in 4 independent experiments. Statistical bars represent standard deviations. Statistically significant differences (p< = 0.05) are indicated with a (*) (A–H).
Figure 2
Figure 2. AID is haploinsufficient for SHM.
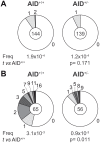
(A) Sμ mutation frequency in AID+/+ and AID+/− activated B cells. The Sμ mutation frequency was quantified in sorted CFSE-labelled spleen B cells that had undergone 5 or more divisions after 96h of LPS and IL4 stimulation. Segment sizes in the pie charts are proportional to the number of Sμ sequences carrying the number of mutations indicated in the periphery of the charts. The total number of independent sequences analyzed is indicated in the center of each chart. The calculated mutation frequency per base pair is indicated underneath. Statistical significance was determined by a two-tailed Student's t test comparing the frequency found in AID+/+ and AID+/− B cells. P values are indicated. (B) SHM analyzed in the intronic region 3′ of JH4 of germinal center B cells from AID+/+ and AID+/− mice. Segment sizes in the pie charts are proportional to the number of mutations found in the intronic region 3′ of JH4 of Fas+GL7+ sorted B cells from Peyer's patches of aged-matched AID+/+ and AID+/− mice. The total number of independent sequences analyzed is indicated in the center of each chart. The calculated mutation frequency per base pair is indicated underneath. Statistical significance was determined by a two-tailed Student's t test comparing the frequency of mutations found in AID+/+ and AID+/− mice. P values are indicated.
Figure 3
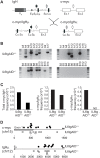
Figure 3. c-myc/IgH translocation frequency is reduced in IL6tgAID+/− mice.
(A) Schematic representation of the IgH and c-myc genes (upper) and the derivative chromosomes (c-myc/IgHμ and c-myc/IgHα, lower) arising from proximal and distal translocations, respectively. Variable (VH) and constant (Cμ and Cα) genes are represented as grey and black boxes, respectively. Sμ and Sα switch regions and Eμ enhancer are shown as striped and black ellipses, respectively. C-myc exons are drawn as white boxes. Arrows show the position of primers used for PCR amplification. (B) Proximal (left) and distal (right) c-myc/IgH translocations detected in IL6tgAID+/+ (upper gels) and IL6tgAID+/− (lower gels) mice. DNA from IL6tgAID+/+ and IL6tgAID+/− hyperplastic lymph node B cells was amplified as described in materials and methods using the primers depicted in (A). Representative amplification products analysed in ethidium bromide stained gels are shown. Mouse identifications are shown above the lanes. (C) Frequency of c-myc/IgH translocations in IL6tgAID+/+ and IL6tgAID+/− mice. Translocation frequency was determined by serial dilution of DNA samples, followed by PCR amplification, cloning and sequencing. Graphs show the overall translocation frequency (left), frequency of proximal c-myc/IgHμ translocations (middle) and frequency of distal c-myc/IgHα translocations (right). (D) Representation of translocation breakpoints at the c-myc and IgHμ genes found in IL6tgAID+/+ and IL6tgAID+/− B cells. Amplification products of proximal c-myc/IgH translocations were cloned and sequenced. Translocation breakpoints at the c-myc (upper diagram) and IgH (lower diagram) genes are shown as closed (IL6tgAID+/+) and open (IL6tgAID+/−) circles. C-myc exon 1 and IgH Eμ enhancer are represented as grey boxes and distance to these elements is shown underneath (bps). Arrows on the right indicate the position of the PCR oligonucleotides used for amplification.
Figure 4
Figure 4. c-myc/IgH translocation frequency is reduced in activated AID+/− B cells.
(A) p53+/−AID+/− cells are haploinsufficient for CSR. Spleen B cells from p53+/−AID+/+ and p53+/−AID+/− were stimulated for the indicated times (X axis) in the presence of LPS and IL4. Percentage of IgG1+ as measured by flow cytometry is represented (Y axis). Statistical bars show standard deviations. p values (p53+/−AID+/− vs p53+/−AID+/+) 48h, 0.7; 72h, 0.01; 96h, 6×10⁻³; 120h, 0.03. (unpaired two-tailed t test, n = 4). (B) Representative c-myc/IgH translocations detected in p53+/−AID+/+ and p53+/−AID+/− B cells. Spleen B cells from p53+/−AID+/+ and p53+/−AID+/− mice were stimulated in vitro in the presence of LPS and IL4 for 3 days. DNA was extracted and proximal translocations were amplified by PCR as depicted in Fig 2a (see materials and methods) and analysed in ethidium bromide stained agarose gels (upper). Specificity of amplification products was determined by southern blot and hybridization with IgH (middle) and myc (lower) probes. Results for p53+/−AID+/+ and p53+/−AID+/− cells are shown on the left and right gels, respectively. Translocation identifications are indicated above lanes. (C) Frequency of c-myc/IgH translocations in p53+/−AID+/+ and p53+/−AID+/− B cells. Translocation frequency was determined by serial dilution of DNA samples, followed by PCR amplification, cloning and sequencing. (D) Representation of translocation breakpoints at the c-myc and IgHμ genes found in p53+/−AID+/+ and p53+/−AID+/− B cells. Amplification products of c-myc/IgH translocations were cloned and sequenced. Translocation breakpoints at the c-myc (upper diagram) and IgH (lower diagram) genes are shown as closed (p53+/−AID+/+) and open (p53+/−AID+/−) circles. C-myc exon 1 and IgH Eμ enhancer are represented as grey boxes and distance to these elements is shown underneath (bps). Arrows on the right indicate the position of the PCR oligonucleotides used for amplification.

Similar articles

Cited by

References

    1. Schatz DG. V(D)J recombination. Immunol Rev. 2004;200:5–11. - PubMed
    1. Peled JU, Kuang FL, Iglesias-Ussel MD, Roa S, Kalis SL, et al. The biochemistry of somatic hypermutation. Annu Rev Immunol. 2008;26:481–511. - PubMed
    1. Di Noia JM, Neuberger MS. Molecular mechanisms of antibody somatic hypermutation. Annu Rev Biochem. 2007;76:1–22. - PubMed
    1. Stavnezer J. Antibody class switching. Adv Immunol. 1996;61:79–146. - PubMed
    1. Stavnezer J. Molecular processes that regulate class switching. Curr Top Microbiol Immunol. 2000;245:127–168. - PubMed

Publication types

MeSH terms

Substances

LinkOut - more resources