Transition State Structure for the Hydrolysis of NAD Catalyzed by Diphtheria Toxin
- PMID: 19079637
- PMCID: PMC2601651
- DOI: 10.1021/ja971317a
Transition State Structure for the Hydrolysis of NAD Catalyzed by Diphtheria Toxin
Abstract
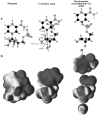
Diphtheria toxin (DTA) uses NAD(+) as an ADP-ribose donor to catalyze the ADP-ribosylation of eukaryotic elongation factor 2. This inhibits protein biosynthesis and ultimately leads to cell death. In the absence of its physiological acceptor, DTA catalyzes the slow hydrolysis of NAD(+) to ADP-ribose and nicotinamide, a reaction that can be exploited to measure kinetic isotope effects (KIEs) of isotopically labeled NAD(+)s. Competitive KIEs were measured by the radiolabel method for NAD(+) molecules labeled at the following positions: 1-(15)N = 1.030 ± 0.004, 1'-(14)C = 1.034 ± 0.004, (1-(15)N,1'-(14)C) = 1.062 ± 0.010, 1'-(3)H = 1.200 ± 0.005, 2'-(3)H = 1.142 ± 0.005, 4'-(3)H = 0.990 ± 0.002, 5'-(3)H = 1.032 ± 0.004, 4'-(18)O = 0.986 ± 0.003. The ring oxygen, 4'-(18)O, KIE was also measured by whole molecule mass spectrometry (0.991 ± 0.003) and found to be within experimental error of that measured by the radiolabel technique, giving an overall average of 0.988 ± 0.003. The transition state structure of NAD(+) hydrolysis was determined using a structure interpolation method to generate trial transition state structures and bond-energy/bond-order vibrational analysis to predict the KIEs of the trial structures. The predicted KIEs matched the experimental ones for a concerted, highly oxocarbenium ion-like transition state. The residual bond order to the leaving group was 0.02 (bond length = 2.65 Å), while the bond order to the approaching nucleophile was 0.03 (2.46 Å). This is an A(N)D(N) mechanism, with both leaving group and nucleophilic participation in the reaction coordinate. Fitting the transition state structure into the active site cleft of the X-ray crystallographic structure of DTA highlighted the mechanisms of enzymatic stabilization of the transition state. Desolvation of the nicotinamide ring, stabilization of the oxocarbenium ion by apposition of the side chain carboxylate of Glu148 with the anomeric carbon of the ribosyl moiety, and the placement of the substrate phosphate near the positively charged side chain of His21 are all consistent with the transition state features from KIE analysis.
Figures


Similar articles
-
Transition state structure for ADP-ribosylation of eukaryotic elongation factor 2 catalyzed by diphtheria toxin.Biochemistry. 2004 Feb 10;43(5):1204-12. doi: 10.1021/bi035907z. Biochemistry. 2004. PMID: 14756556
-
Kinetic isotope effect characterization of the transition state for oxidized nicotinamide adenine dinucleotide hydrolysis by pertussis toxin.Biochemistry. 1997 Apr 15;36(15):4526-34. doi: 10.1021/bi962841h. Biochemistry. 1997. PMID: 9109661
-
Pertussis toxin: transition state analysis for ADP-ribosylation of G-protein peptide alphai3C20.Biochemistry. 1997 Jul 8;36(27):8215-23. doi: 10.1021/bi970379a. Biochemistry. 1997. PMID: 9204866
-
The ARTT motif and a unified structural understanding of substrate recognition in ADP-ribosylating bacterial toxins and eukaryotic ADP-ribosyltransferases.Int J Med Microbiol. 2002 Feb;291(6-7):523-9. doi: 10.1078/1438-4221-00162. Int J Med Microbiol. 2002. PMID: 11890553 Review.
-
ARH Family of ADP-Ribose-Acceptor Hydrolases.Cells. 2022 Nov 30;11(23):3853. doi: 10.3390/cells11233853. Cells. 2022. PMID: 36497109 Free PMC article. Review.
Cited by
-
Transition States.J Biol Chem. 2009 Nov 20;284(47):32201-8. doi: 10.1074/jbc.X109.060111. Epub 2009 Sep 16. J Biol Chem. 2009. PMID: 19758992 Free PMC article. No abstract available.
-
ADP-ribosylation of arginine.Amino Acids. 2011 Jul;41(2):257-69. doi: 10.1007/s00726-010-0676-2. Epub 2010 Jul 21. Amino Acids. 2011. PMID: 20652610 Free PMC article. Review.
-
Experimental and computational analysis of the transition state for ribonuclease A-catalyzed RNA 2'-O-transphosphorylation.Proc Natl Acad Sci U S A. 2013 Aug 6;110(32):13002-7. doi: 10.1073/pnas.1215086110. Epub 2013 Jul 22. Proc Natl Acad Sci U S A. 2013. PMID: 23878223 Free PMC article.
-
Inaccuracies in selected ion monitoring determination of isotope ratios obviated by profile acquisition: nucleotide 18O/16O measurements.Anal Biochem. 2007 Aug 1;367(1):28-39. doi: 10.1016/j.ab.2007.03.037. Epub 2007 Apr 2. Anal Biochem. 2007. PMID: 17560863 Free PMC article.
-
A ribose-functionalized NAD+ with unexpected high activity and selectivity for protein poly-ADP-ribosylation.Nat Commun. 2019 Sep 13;10(1):4196. doi: 10.1038/s41467-019-12215-4. Nat Commun. 2019. PMID: 31519936 Free PMC article.
References
-
- van Geldermalsen AA, Wenning U. Ann. Trop. Paediatr. 1993;13:13–19. - PubMed
-
- Hardy IR, Dittmann S, Sutter RW. Lancet. 1996;347:1739–1744. - PubMed
-
- Koo D, Traverso H, Libel M, Drasbek C, Tauxe R, Brandling-Bennett D. Bull. Pan Am. Health Org. 1996;30:134–143. - PubMed
-
- Swerdlow DL, Levine O, Toole MJ, Waldman RJ, Tauxe RV. Lancet. 1994;344:1302–1303. - PubMed
-
- Siddique AK, Salam A, Islam MS, Akram K, Majumdar RN, Zaman K, Fronczak N, Laston S. Lancet. 1995;345:359–361. - PubMed
Grants and funding
LinkOut - more resources
Full Text Sources
