. 2008;1(1):22-31.
Epub 2008 Jan 10.

Sepsis-induced inflammation is exacerbated in an animal model of type 2 diabetes

Affiliations

Sepsis-induced inflammation is exacerbated in an animal model of type 2 diabetes

Asha Jacob et al. Int J Clin Exp Med. 2008.

Abstract

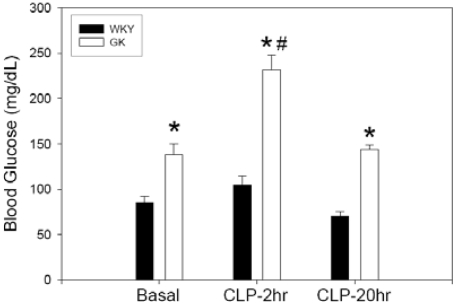
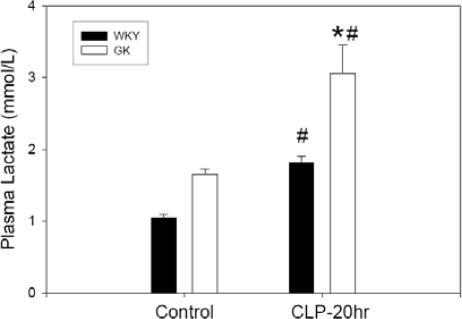
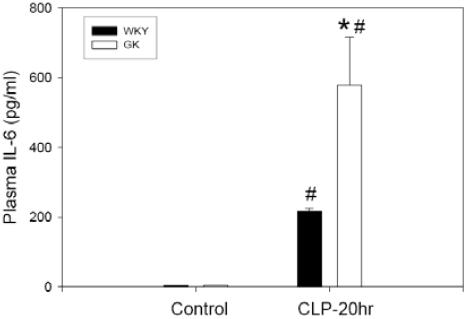
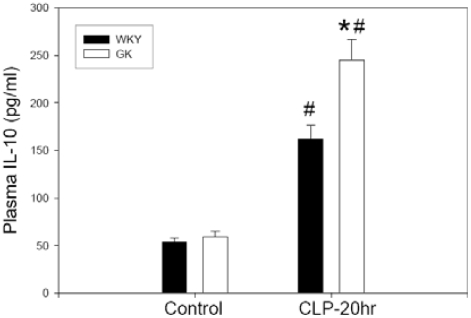
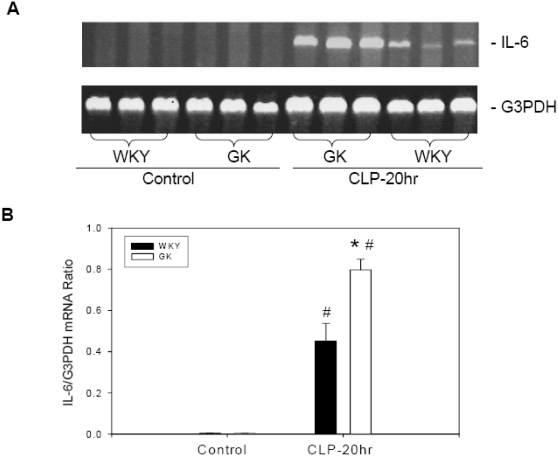
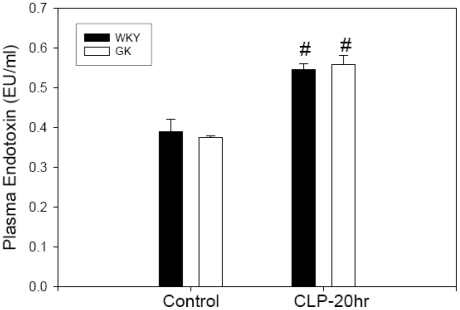
Hyperglycemia is common in critically ill patients and pronounced hyperglycemia may lead to complications which include severe infections, polyneuropathy, multiple organ failure and death in such patients. Sustained hyperglycemia is generally observed in patients with Type 2 diabetes. To explore sepsis-induced inflammation in Type 2 diabetes, polymicrobial sepsis was induced by cecal ligation and puncture (CLP) in the Goto-Kakizaki (GK) rat, a spontaneous animal model of Type 2 diabetes. The Wistar-Kyoto (WKY) rats, non-diabetic inbred rats, were used as controls for the experiment. Blood glucose levels were measured at basal, 2 hr and 20 hr after CLP. At 20 hr after CLP, blood and tissue samples were collected. Plasma levels of lactate, IL-6, IL-10 and endotoxins were measured. Total RNA from liver tissues were extracted and subjected to reverse transcription-polymerase chain reaction using rat specific IL-6 primers. GK rats exhibited significantly elevated basal glucose levels compared to WKY rats. Glucose levels in septic GK rats were significantly elevated compared to WKY rats at all time points studied. While both WKY and GK rats showed significant increases in IL-6 at 20 hr after CLP, the GK rats exhibited an average 2.68-fold increase than that of WKY rats. At 20 hr after CLP, hepatic IL-6 gene expression in GK rats was 1.77-fold greater than that of WKY rats. Although, both WKY and GK rats showed significant increases in plasma lactate levels at 20 hr after CLP, the GK rats exhibited an average increase of 1.69-fold, from the already elevated basal levels, than that of WKY rats. Since the lactate levels in GK sham groups were slightly higher than that of WKY sham, the relative changes in the fold induction by CLP between strains were similar. Both WKY and GK rats showed significantly elevated endotoxin levels at 20 hr after CLP, but no statistical differences were observed between the two groups. These studies suggest that sepsis-induced inflammation is exacerbated in an animal model of Type 2 diabetes.

Keywords: GK rats; IL-10; IL-6; Type 2 diabetes; cecal ligation and puncture; rodent model of type 2 diabetes; sepsis.


Figures

Figure 1
Figure 1
Changes in blood glucose in septic WKY and GK rats. Polymicrobial sepsis was induced by CLP in WKY and GK rats. Blood glucose levels were measured at different time points by a commercially available glucose meter. Basal glucose levels were significantly increased in GK rats as compared to WKY rats. At 2 hr and 20 hr after CLP, glucose levels were significantly higher in GK rats as compared to corresponding time points in WKY rats. The data are presented as mean ± SE and compared by one-way ANOVA and Student-Newman-Keuls method. *P<0.05 versus WKY rats; #P<0.05 versus respective basal levels.
Figure 2
Figure 2
Changes in plasma lactate in septic WKY and GK rats. Sepsis was induced by CLP and blood samples were collected at 20 hr after CLP. Plasma lactate was analyzed using commercial assay kits. At 20 hr after CLP, plasma lactate was significantly higher in GK rats as compared to WKY rats. The data are presented as mean ± SE and compared by one-way ANOVA and Student-Newman-Keuls method. *P< 0.05 versus WKY rats; #P<0.05 versus respective controls.
Figure 3
Figure 3
Changes in plasma IL-6 in septic WKY and GK rats. Sepsis was induced by CLP and blood samples were collected at 20 hr after CLP. Plasma IL-6 was measured with antibody specific for rat IL-6 using an ELISA kit. At 20 hr after CLP, plasma IL-6 was significantly higher in GK rats as compared to WKY rats. The data are presented as mean ± SE and compared by one-way ANOVA and Student-Newman-Keuls method. *P< 0.05 versus WKY rats; #P<0.05 versus respective controls.
Figure 4
Figure 4
Changes in plasma IL-10 in septic WKY and GK rats. Sepsis was induced by CLP and blood samples were collected at 20 hr after CLP. Plasma IL-10 was measured with antibody specific for rat IL-10 using an ELISA kit. At 20 hr after CLP, plasma IL-10 was significantly higher in GK rats as compared to WKY rats. The data are presented as mean ± SE and compared by one-way ANOVA and Student-Newman-Keuls method. *P< 0.05 versus WKY rats; #P<0.05 versus respective controls.
Figure 5
Figure 5
Changes in IL-6 gene expression in septic WKY and GK rats. Sepsis was induced by CLP and liver tissues were collected at 20 hr after CLP. RNA was extracted and analyzed by RT-PCR using primers specific for rat IL-6 cDNA. G3PDH was used as an internal control. PCR products were electrophoresed on 1.6% agarose gel and visualized by ethidium bromide staining. A. Photograph of a representative agarose gel. B. Densitometric analyzes of the ratio between IL-6 and G3PDH mRNA expression (calculated as arbitrary densitometric values obtained from IL-6 gene expression divided by G3PDH values in corresponding lanes). The data are presented as mean ± SE and compared by one-way ANOVA and Student-Newman-Keuls method. *P<0.05 versus WKY rats; #P<0.05 versus respective controls.
Figure 6
Figure 6
No change in plasma endotoxin between WKY and GK rats. Sepsis was induced by CLP and blood samples were collected at 20 hr after CLP. Plasma concentrations of endotoxin were determined using the microplate method of the Chromogenic Limulus Amebocyte Lysate (LAL) Test. Endotoxin levels were significantly increased in both GK and WKY rats at 20 hr after CLP. Either at control or at 20 hr after CLP, plasma endotoxins were not different between the GK and WKY rats. The data are presented as mean ± SE and compared by one-way ANOVA and Student-Newman-Keuls method. #P<0.05 versus respective controls.

Similar articles

Cited by

References

    1. Annane D, Aegerter P, Jars-Guincestre MC, Guidet B. Current epidemiology of septic shock: the CUB-Rea Network. Am J Respir Crit Care Med. 2003;168:165–72. - PubMed
    1. Jacober SJ, Sowers JR. An update on perioperative management of diabetes. Arch Intern Med. 1999;159:2405–11. - PubMed
    1. Browne JA, Cook C, Pietrobon R, Bethel MA, Richardson WJ. Diabetes and early postoperative outcomes following lumbar fusion. Spine. 2007;32:2214–9. - PubMed
    1. Golden SH, Peart-Vigilance C, Kao WH, Brancati FL. Perioperative glycemic control and the risk of infectious complications in a cohort of adults with diabetes. Diabetes Care. 1999;22:1408–14. - PubMed
    1. Pomposelli JJ, Baxter JK, 3rd, Babineau TJ, Pomfret EA, Driscoll DF, Forse RA, Bistrian BR. Early postoperative glucose control predicts nosocomial infection rate in diabetic patients. JPEN J Parenter Enteral Nutr. 1998;22:77–81. - PubMed

LinkOut - more resources