

Peak deconvolution in high-field asymmetric waveform ion mobility spectrometry (FAIMS) to characterize macromolecular conformations
- PMID: 19079801
- PMCID: PMC2600534
- DOI: 10.1016/j.ijms.2006.09.011
Peak deconvolution in high-field asymmetric waveform ion mobility spectrometry (FAIMS) to characterize macromolecular conformations
Abstract
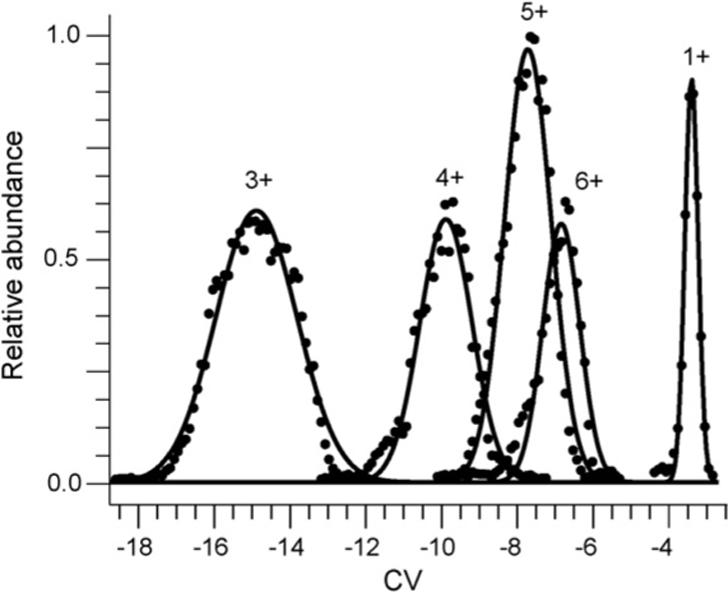
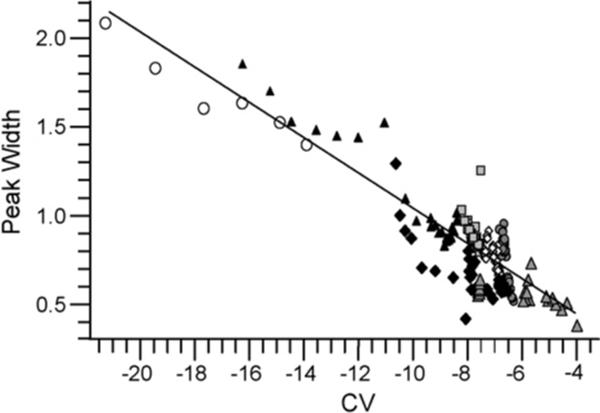
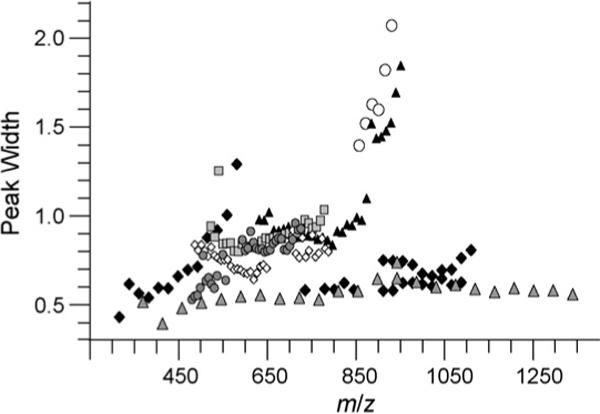
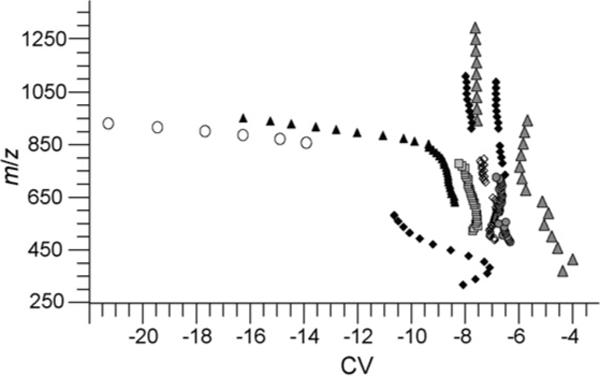
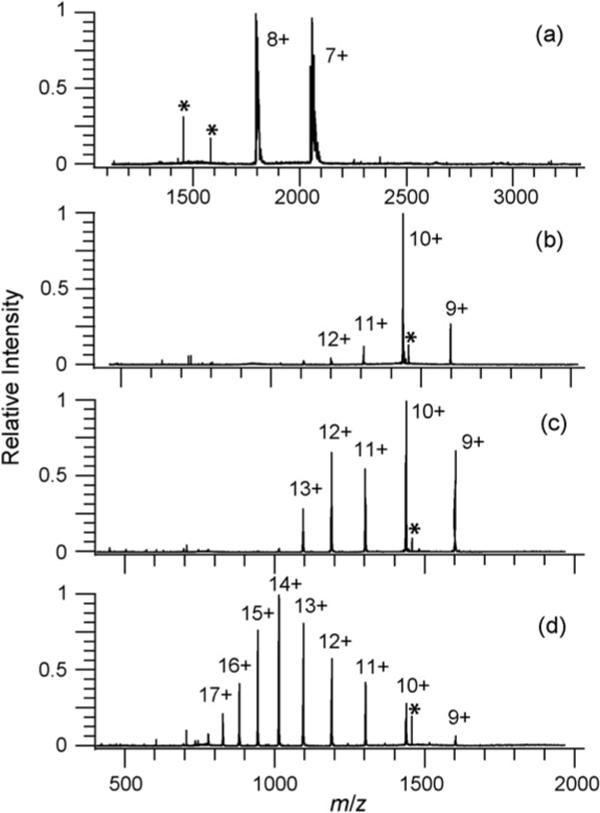
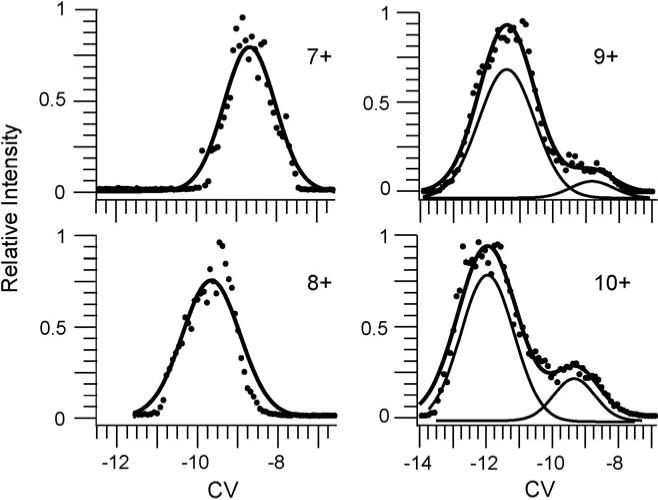
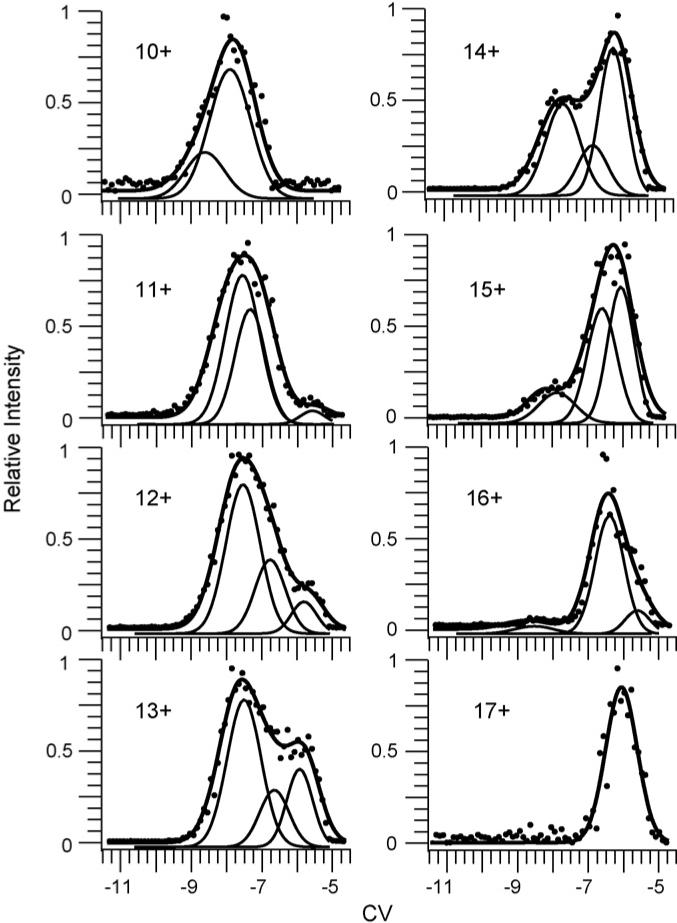
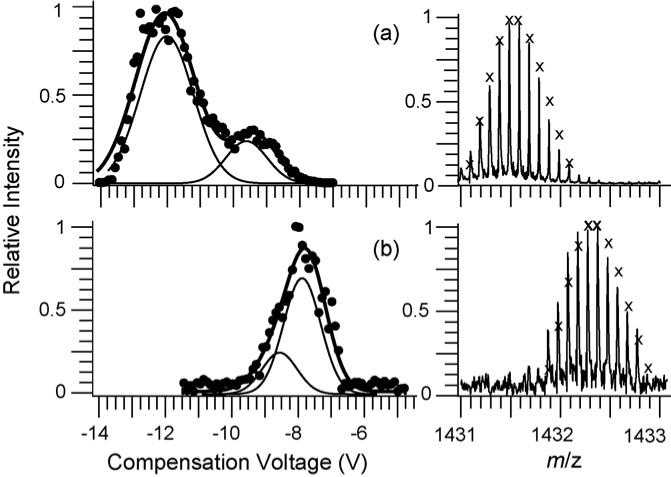
Protonated poly(ethylene glycol), produced by electrospray ionization (ESI), with molecular weights ranging from 0.3 to 5 kDa and charge states from 1+ to 7+ were characterized using high-field asymmetric waveform ion mobility spectrometry (FAIMS). Results for all but some of the 3+ and 4+ charge states are consistent with a single gas-phase conformer or family of unresolved conformers for each of these charge states. The FAIMS compensation voltage scans resulted in peaks that could be accurately fit with a single Gaussian for each peak. The peak widths increase linearly with compensation voltage for maximum ion transmission but do not depend on m/z or molecular weight. Fitting parameters obtained from the poly(ethylene glycol) data were used to analyze conformations of oxidized and reduced lysozyme formed from different solutions. For oxidized lysozyme formed from a buffered aqueous solution, a single conformer (or group of unresolved conformers) was observed for the 7+ and 8+ charge states. Two conformers were observed for the 9+ and 10+ charge states formed from more denaturing solutions. Data for the fully reduced form indicate the existence of up to three different conformers for each charge state produced directly by ESI and a general progression from a more extended to a more folded structure with decreasing charge state. These results are consistent with those obtained previously by proton-transfer reactivity and drift tube ion mobility experiments, although more conformers were identified for the fully reduced form of lysozyme using FAIMS.
Figures
Similar articles
-
Investigation of bovine ubiquitin conformers separated by high-field asymmetric waveform ion mobility spectrometry: cross section measurements using energy-loss experiments with a triple quadrupole mass spectrometer.J Am Soc Mass Spectrom. 2000 Aug;11(8):738-45. doi: 10.1016/S1044-0305(00)00136-7. J Am Soc Mass Spectrom. 2000. PMID: 10937797
-
Elongated conformers of charge states +11 to +15 of bovine ubiquitin studied using ESI-FAIMS-MS.J Am Soc Mass Spectrom. 2001 Aug;12(8):894-901. doi: 10.1016/S1044-0305(01)00272-0. J Am Soc Mass Spectrom. 2001. PMID: 11506222
-
Separation of beta2-microglobulin conformers by high-field asymmetric waveform ion mobility spectrometry (FAIMS) coupled to electrospray ionisation mass spectrometry.Rapid Commun Mass Spectrom. 2004;18(19):2229-34. doi: 10.1002/rcm.1613. Rapid Commun Mass Spectrom. 2004. PMID: 15384141
-
High-field asymmetric waveform ion mobility spectrometry for mass spectrometry-based proteomics.Expert Rev Proteomics. 2012 Oct;9(5):505-17. doi: 10.1586/epr.12.50. Expert Rev Proteomics. 2012. PMID: 23194268 Free PMC article. Review.
-
High-field asymmetric waveform ion mobility spectrometry: a new tool for mass spectrometry.J Chromatogr A. 2004 Nov 26;1058(1-2):3-19. J Chromatogr A. 2004. PMID: 15595648 Review.
Cited by
-
Conformation types of ubiquitin [M+8H]8+ Ions from water:methanol solutions: evidence for the N and A States in aqueous solution.J Phys Chem B. 2012 Mar 15;116(10):3344-52. doi: 10.1021/jp210797x. Epub 2012 Mar 2. J Phys Chem B. 2012. PMID: 22315998 Free PMC article.
-
Targeted high-resolution ion mobility separation coupled to ultrahigh-resolution mass spectrometry of endocrine disruptors in complex mixtures.Anal Chem. 2015 Apr 21;87(8):4321-5. doi: 10.1021/ac504866v. Epub 2015 Apr 8. Anal Chem. 2015. PMID: 25818070 Free PMC article.
-
A high voltage asymmetric waveform generator for FAIMS.J Am Soc Mass Spectrom. 2010 Jul;21(7):1118-21. doi: 10.1016/j.jasms.2010.02.019. Epub 2010 Feb 18. J Am Soc Mass Spectrom. 2010. PMID: 20332067 Free PMC article.
-
Protein-Glass Surface Interactions and Ion Desalting in Electrospray Ionization with Submicron Emitters.J Am Soc Mass Spectrom. 2018 Jan;29(1):194-202. doi: 10.1007/s13361-017-1825-6. Epub 2017 Oct 12. J Am Soc Mass Spectrom. 2018. PMID: 29027129
-
Analysis of Photoirradiated Water Accommodated Fractions of Crude Oils Using Tandem TIMS and FT-ICR MS.Environ Sci Technol. 2017 Jun 6;51(11):5978-5988. doi: 10.1021/acs.est.7b00508. Epub 2017 May 9. Environ Sci Technol. 2017. PMID: 28457132 Free PMC article.
References
-
- Smith RD. Trends Biotechnol. 2002;20:S3. - PubMed
-
- Washburn MP, Wolters D, Yates JR. Nat. Biotechnol. 2001;19:242. - PubMed
-
- Shvartsburg AA, Tang K, Smith RD. J. Am. Soc. Mass Spectrom. 2005;16:2. - PubMed
-
- Valentine SJ, Kulchania M, Barnes CAS, Clemmer DE. Int. J. Mass Spectrom. 2001;212:97.
-
- Lee YJ, Hoaglund-Hyzera CS, Barnes CAS, Hilderbrand AE, Valentine SJ, Clemmer DE. J. Chromatogr. B. 2002;782:343. - PubMed
Grants and funding
LinkOut - more resources
Full Text Sources