Mapping cancer for community engagement
- PMID: 19080009
- PMCID: PMC2644580
Mapping cancer for community engagement
Abstract
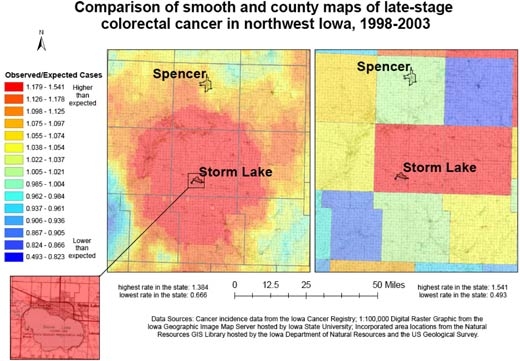
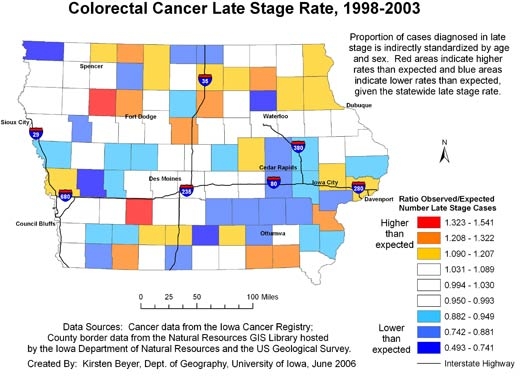
Introduction: Two research strategies may reduce health disparities: community participation and the use of geographic information systems. When combined with community participation, geographic information systems approaches, such as the creation of disease maps that connect disease rates with community context, can catalyze action to reduce health disparities. However, current approaches to disease mapping often focus on the display of disease rates for political or administrative units. This type of map does not provide enough information on the local rates of cancer to engage community participation in addressing disparities.
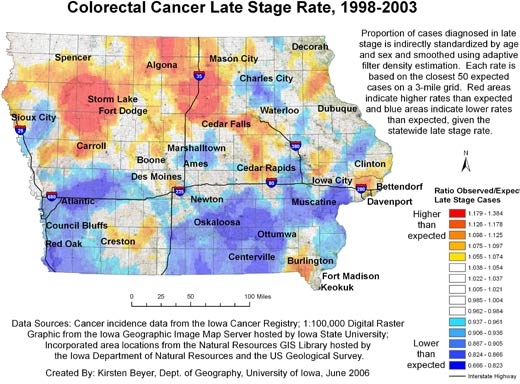
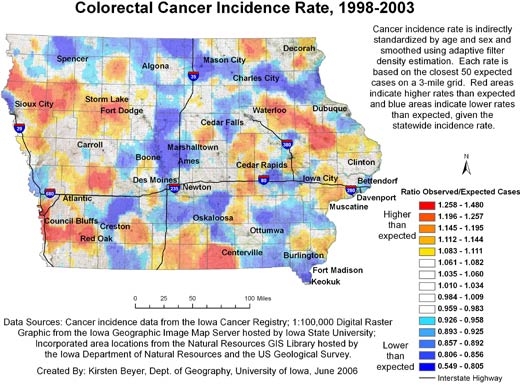
Methods: We collaborated with researchers and cancer prevention and control practitioners and used adaptive spatial filtering to create maps that show continuous surface representations of the proportion of all colorectal cancer cases diagnosed in the late stage. We also created maps that show the incidence of colorectal cancer.
Results: Our maps show distinct patterns of cancer and its relationship to community context. The maps are available to the public on the Internet and through the activities of Iowa Consortium for Comprehensive Cancer Control partners.
Conclusion: Community-participatory approaches to research are becoming more common, as are the availability of geocoded data and the use of geographic information systems to map disease. If researchers and practitioners are to engage communities in exploring cancer rates, maps should be made that accurately represent and contextualize cancer in such a way as to be useful to people familiar with the characteristics of their local areas.
Figures
References
-
- Cancer health disparities: questions and answers. Bethesda (MD): National Cancer Institute; [Accessed October 14, 2008]. 2008. http://www.cancer.gov/cancertopics/factsheet/cancer-health-disparities .
-
- Cancer. In: Healthy people 2010: understanding and improving health and objectives for improving health (part A) Washington (DC): US Department of Health and Human Services; [Accessed May 1, 2006]. 2001. http://www.healthypeople.gov/document/HTML/Volume1/03Cancer.htm .
-
- National Cancer Institute. Cancer trends progress report — 2005 update. MD. Bethesda (MD): National Institutes of Health, US Department of Health and Human Services; 2005.
-
- Ward E, Jemal A, Cokkinides V, Singh GK, Cardinez C, Ghafoor A, et al. Cancer disparities by race/ethnicity and socioeconomic status. CA Cancer J Clin. 2004;54(2):78–93. - PubMed
-
- Singh GK, Miller BA, Hankey BF, Edwards BK. Area socioeconomic variations in US cancer incidence, mortality, stage, treatment, and survival, 1975-1999. Bethesda (MD): US Department of Health and Human Services, National Institutes of Health, National Cancer Institute; 2003.
Publication types
MeSH terms
Grants and funding
LinkOut - more resources
Full Text Sources
Medical