. 2008 Dec 10;16(12):1817-27.
doi: 10.1016/j.str.2008.10.008.

Structural basis for calcium sensing by GCaMP2

Affiliations

Structural basis for calcium sensing by GCaMP2

Qi Wang et al. Structure. .

Abstract

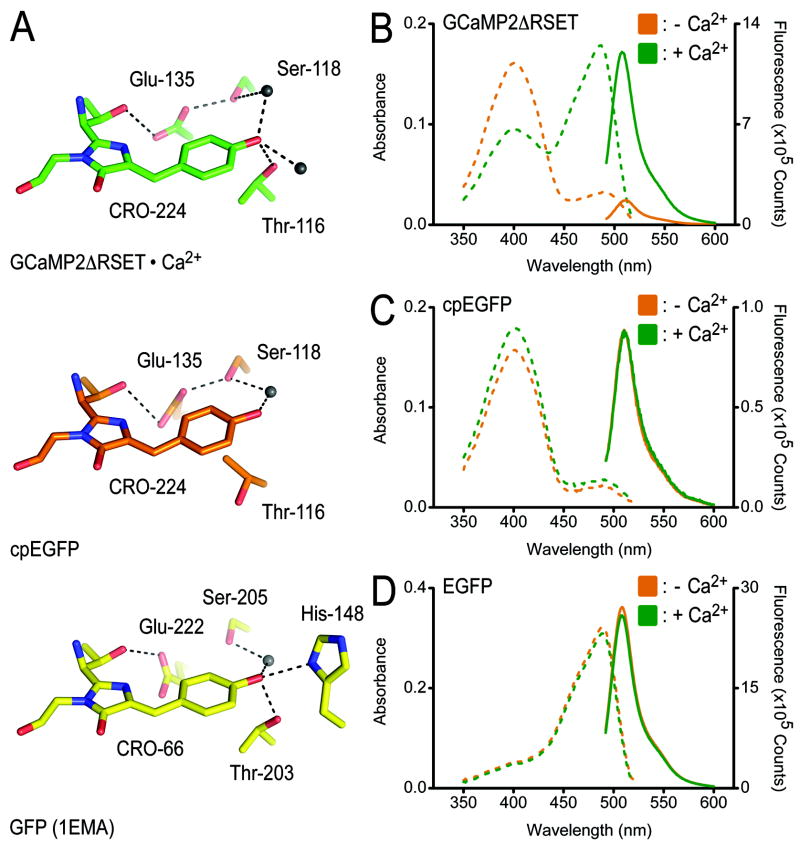
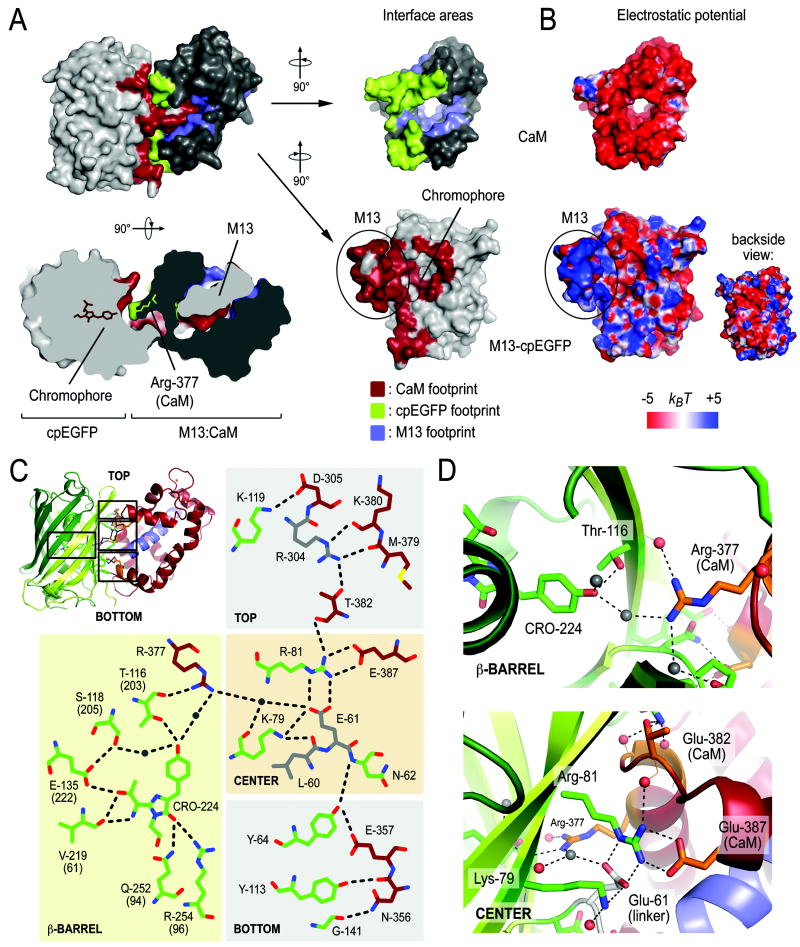
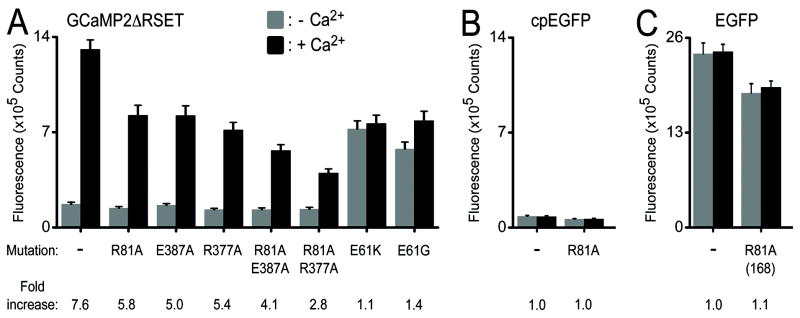
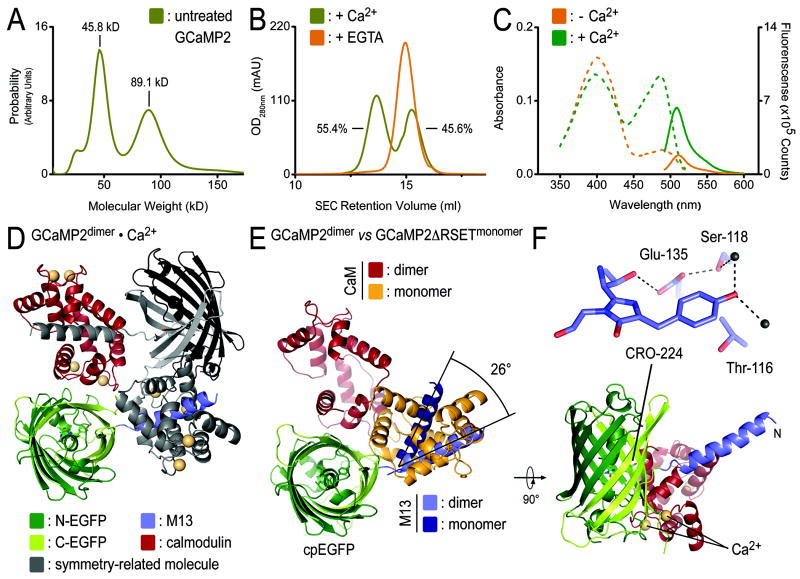
Genetically encoded Ca(2+) indicators are important tools that enable the measurement of Ca(2+) dynamics in a physiologically relevant context. GCaMP2, one of the most robust indicators, is a circularly permutated EGFP (cpEGFP)/M13/calmodulin (CaM) fusion protein that has been successfully used for studying Ca(2+) fluxes in vivo in the heart and vasculature of transgenic mice. Here we describe crystal structures of bright and dim states of GCaMP2 that reveal a sophisticated molecular mechanism for Ca(2+) sensing. In the bright state, CaM stabilizes the fluorophore in an ionized state similar to that observed in EGFP. Mutational analysis confirmed critical interactions between the fluorophore and elements of the fused peptides. Solution scattering studies indicate that the Ca(2+)-free form of GCaMP2 is a compact, predocked state, suggesting a molecular basis for the relatively rapid signaling kinetics reported for this indicator. These studies provide a structural basis for the rational design of improved Ca(2+)-sensitive probes.


Figures

Figure 1
Figure 1. Crystal structures of GCaMP2•Ca2+ and cpEGFP
(A) Domain organization of GCaMP2 and truncated derivatives. A schematic presentation of the GCaMP2 fusion protein is shown. The color scheme introduced here is maintained throughout the manuscript. Residue numbering for circularly permutated EGFP (cpEGFP) and GCaMP2ΔRSET follows the sequence of GCaMP2. (B) Crystal structure of the isolated cpEGFP moiety. The C-terminal fragment of C-EGFP is colored in light green, the N-terminal fragment is colored in dark green. Two orthogonal views are shown. (C) Crystal structure of monomeric GCaMP2ΔRSET in its Ca2+-bound state. Crystals were grown in the presence of 1 mM Ca2+. Two orthogonal views are shown. The M13 helix is shown in blue, and the calmodulin (CaM) domain is shown in red. The cpEFGP is colored as described in (B). (D) Comparison of crystal structures of GCaMP2, cpEGFP and GFP-S65T. Distance difference matrices based on Cα positions were used to compare the conformation of cpEGFP in isolation (bottom-right triangle) and as part of GCaMP2 (top-left triangle) with the structure of GFP-S65T (PDB code: 1EMA; see Supplemental Data for details). Difference matrices were regularized using a Z-score analysis and color-coded accordingly. Each entry in the matrix depicts the difference in distance between corresponding Cα atoms in the two structures. Distances that show little change are blue. Red entries represent distances that are significantly different in the two structures.
Figure 2
Figure 2. Coordination of the fluorophore in structures of GCaMP2 and cpEGFP
(A) Close-up view of the fluorophore-interacting residues in GCaMP2ΔRSET•Ca2+ (top), cpEGFP (middle), and GFP-S65T (bottom). Residue labeling is according to GCaMP2 numbering, except labeling of residues in the structure of GFP-S65T (PDB code: 1EMA) (Ormo et al., 1996). Hydrogen bonds are shown as dashed lines. (B) Spectroscopic properties of GCaMP2ΔRSET. Absorbance (dashed lines) and fluorescence emission (solid lines) spectra were measured at 25°C in Ca2+-free (10 mM EGTA; orange) buffer or in the presence of Ca2+ (40 μM; green). See Material and Methods for experimental details. (C) Spectroscopic properties of cpEGFP. Experimental conditions were identical to (B). (D) Spectroscopic properties of EGFP. Experimental conditions were identical to (B).
Figure 3
Figure 3. Intramolecular interfaces in monomeric GCaMP2•Ca2+
(A) Interfaces between the cpEGFP, M13 and CaM modules in the structure of monomeric GCaMP2ΔRSET•Ca2+. Residues of the M13-cpEGFP module interacting with CaM are colored red. Interfacial residues on CaM are colored in green and blue for contacts with cpEGFP and the M13 helix, respectively. A top view, rotated 90° around the horizontal axis with respect to the view shown above, is shown as a cutaway rendition of the surface (bottom-left). The fluorophore of cpEGFP and Arg-377 of CaM are shown in stick presentation. Surface presentation of the isolated CaM domain and M13-cpEGFP unit were rotated by +90° and -90°, respectively, with respect to the view of the assembled structure (top-left). (B) Electrostatic potential of the M13-cpEGFP module and CaM mapped onto its molecular surface. Views are identical to (A). Red represents negative and blue represents positive potential (-5 to +5 kBT). (C) Schematic diagram of the fluorophore environment and the hydrogen bond network between cpEGFP and CaM. The numbering scheme for GCaMP2 was used. Corresponding residue numbers in GFP are shown in brackets. Carbon atoms of residues in cpEGFP, CaM and linker segments are shown in green, dark red, and grey, respectively. Hydrogen bonds shown in the figure are between 2.7 and 3.3Å (not drawn to scale). (D) Close-up views of the interfacial regions in GCaMP2ΔRSET•Ca2+. Water-mediated interaction between the fluorophore and Arg-377 of the CaM domain (top) and cpEGFP:CaM interfacial residues (bottom) are shown.
Figure 4
Figure 4. Mutational analysis of GCaMP2•Ca2+
(A) Mutations in GCaMP2ΔRSET. Interfacial residues shown in Figure 3C and D were mutated. The fluorescence emission spectra were recorded in the presence (black) and absence (grey) of Ca2+. Bar diagrams show emission at 507 nm. (B) Fluorescence emission of corresponding mutations in the isolated cpEGFP module. (C) Fluorescence emission of corresponding mutations in EGFP. The GCaMP2 numbering scheme was used. Arg-81 is equivalent to Arg-168 in GFP and EGFP.
Figure 5
Figure 5. SAXS-based shape reconstruction of GCaMP2 in the presence or absence of Ca2+
(A) Size exclusion chromatographic (SEC) analysis of GCaMP2 in the presence and absence of Ca2+. GCaMP2ΔRSET was purified in its monomeric state (see Material and Methods for details). Proteins were analyzed on a S200 gel filtration column (10/300; GE Healthcare) in gel filtration buffer containing EGTA (10 mM; orange trace) or Ca2+ (1 mM; green trace). (B) Solution scattering data for GCaMP2ΔRSET in its Ca2+-bound and Ca2+-free state. Small-angle X-ray scattering curves of GCaMP2ΔRSET•Ca2+ (green) and its EGTA-treated form (orange) are shown after averaging and solvent-subtraction. Theoretical scattering profiles calculated from the ab initio models with the lowest χ values are shown (black line). The inset shows Guinier plots (including linear fits) at the low angle region (Smax*Rg<1.3). (C) Distance distribution [P(r)] functions for GCaMP2ΔRSET. P(r) curves of GCaMP2ΔRSET•Ca2+ (green) and its EGTA-treated form (orange) were calculated from SAXS data shown in (B) or from the crystal structure of GCaMP2ΔRSET•Ca2+ (dashed line). (D) SAXS-based shape reconstruction of GCaMP2ΔRSET•Ca2+. The overall volume from shape reconstructions after averaging (grey envelope) was calculated from 40 independent models. The crystal structure of monomeric GCaMP2ΔRSET•Ca2+ was docked into the envelope manually. Two orthogonal views are shown. (E) SAXS-based shape reconstruction of Ca2+-free GCaMP2ΔRSET. Details are as described in (C). The crystal structures of cpEGFP and Ca2+-free CaM (PDB code: 3CLN) (Babu et al., 1988) were docked into the envelope manually.
Figure 6
Figure 6. Characterization and crystal structure of dimeric GCaMP2•Ca2+
(A) Identification of a dimeric GCaMP2 by analytical ultracentrifugation. Sedimentation velocity experiments using GCaMP2 purified from E. coli yielded bimodal molecular weight distributions with masses (45.8 kD and 89.1 kD), close to the theoretical mass of monomeric (50.7 kD) and dimeric GCaMP2 (101.4 kD), respectively. (B) Monomerization of GCaMP2 by EGTA-treatment. Size exclusion chromatograms for initial preparation of GCaMP2 showed bimodal distribution of the protein. Both peaks were sensitive to EGTA-treatment, converging to a single peak corresponding to Ca2+-free, monomeric protein. EGTA treatment produced protein that remained monomeric in the presence or absence of Ca2+ (see Figure 5A). (C) Spectroscopic properties of partially dimeric GCaMP2. Absorbance (dashed lines) and fluorescence emission (solid lines) spectra were measured at 25°C in Ca2+-free (10 mM EGTA; orange) buffer or in the presence of Ca2+ (40 μM; green). (D) Crystal structure of the dimeric assembly. Crystals were grown from partially dimeric Ca2+-bound GCaMP2. A crystallographic dimer of GCaMP2 is shown with protomer colored according to the scheme introduced in Figure 1A, and a crystal symmetry-related molecule shown in grey. Ca2+ is shown as yellow spheres. (C) Superposition of monomeric and dimeric GCaMP2. A single protomer of dimeric GCaMP2, colored as in (D), was superimposed on the cpEGFP domain of monomeric GCaMP2ΔRSET•Ca2+, with its M13 helix and CaM module colored in dark blue and orange, respectively. (F) Fluorophore coordination in dimeric GCaMP2•Ca2+. A close-up view of the fluorophore-interacting residues in dimeric GCaMP2•Ca2+ is shown. Residue labeling is according to GCaMP2 numbering.

References

    1. Adams P, Grosse-Kunstleve R, Hung L, Ioerger T, McCoy A, Moriarty N, Read R, Sacchettini J, Sauter N, Terwilliger T. PHENIX: building new software for automated crystallographic structure determination. Acta Crystallogr D Biol Crystallogr. 2002;58:1948–1954. - PubMed
    1. Babu YS, Bugg CE, Cook WJ. Structure of calmodulin refined at 2.2 A resolution. J Mol Biol. 1988;204:191–204. - PubMed
    1. Baird GS, Zacharias DA, Tsien RY. Circular permutation and receptor insertion within green fluorescent proteins. Proc Natl Acad Sci U S A. 1999;96:11241–11246. - PMC - PubMed
    1. Baker NA, Sept D, Joseph S, Holst MJ, McCammon JA. Electrostatics of nanosystems: application to microtubules and the ribosome. Proc Natl Acad Sci U S A. 2001;98:10037–10041. - PMC - PubMed
    1. Brejc K, Sixma TK, Kitts PA, Kain SR, Tsien RY, Ormo M, Remington SJ. Structural basis for dual excitation and photoisomerization of the Aequorea victoria green fluorescent protein. Proc Natl Acad Sci U S A. 1997;94:2306–2311. - PMC - PubMed

Publication types

MeSH terms