. 2008 Dec 10;60(5):803-17.
doi: 10.1016/j.neuron.2008.10.015.

Deregulation of HDAC1 by p25/Cdk5 in neurotoxicity

Affiliations

Deregulation of HDAC1 by p25/Cdk5 in neurotoxicity

Dohoon Kim et al. Neuron. .

Abstract

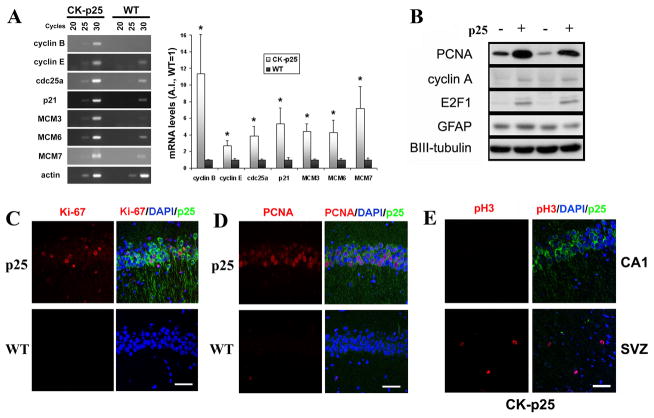
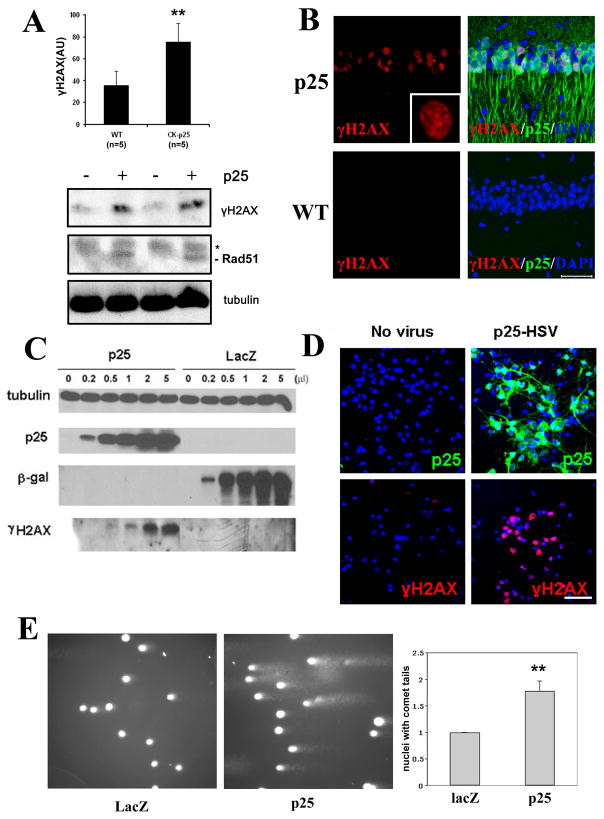
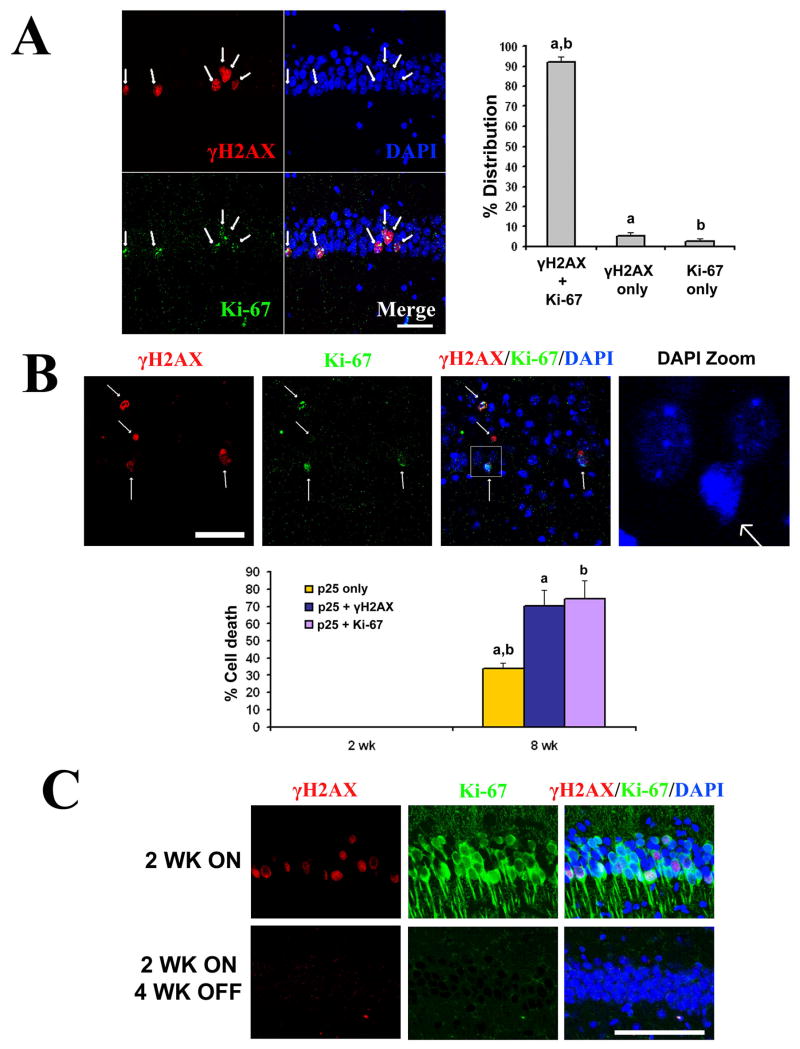
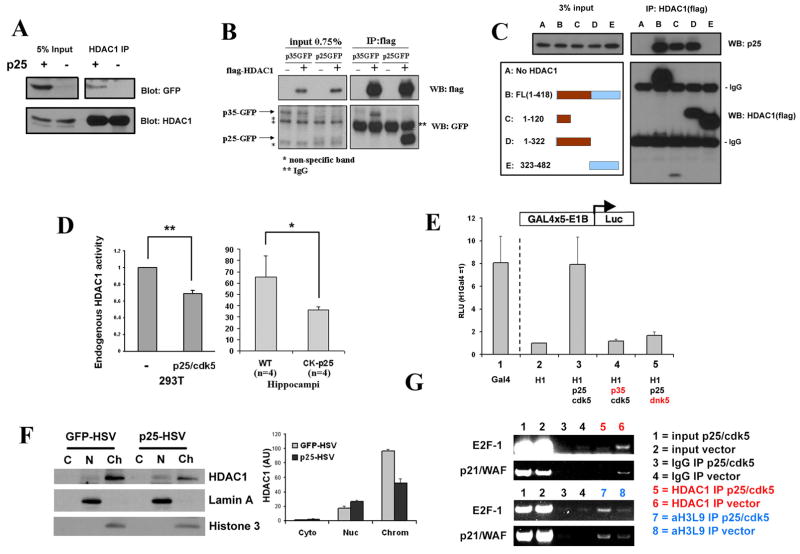
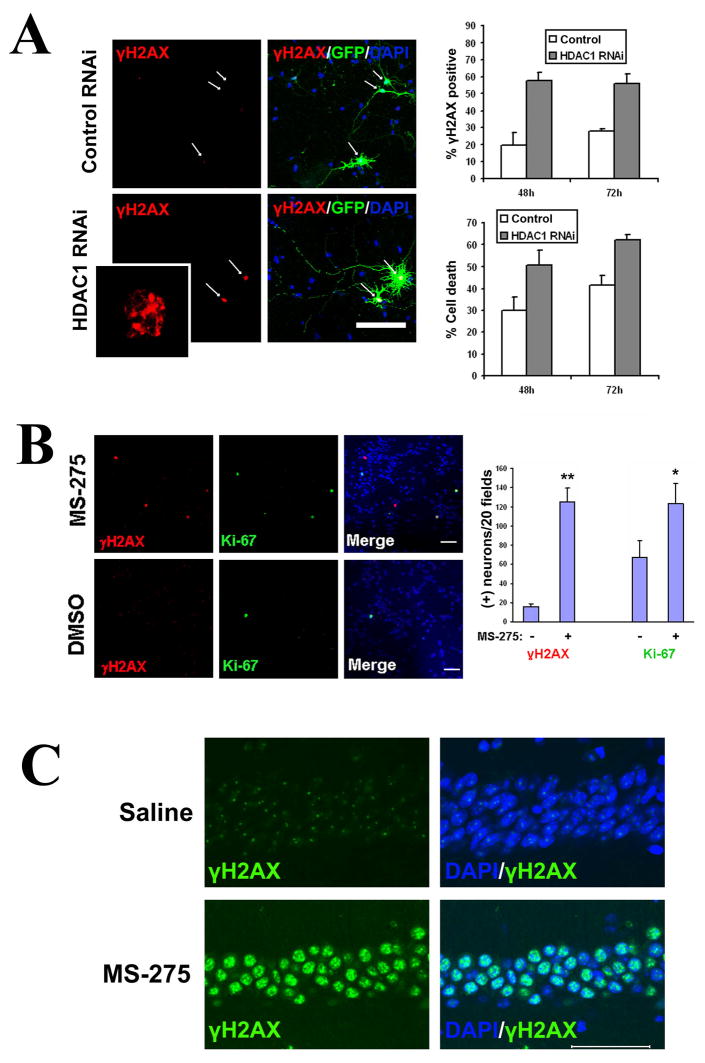
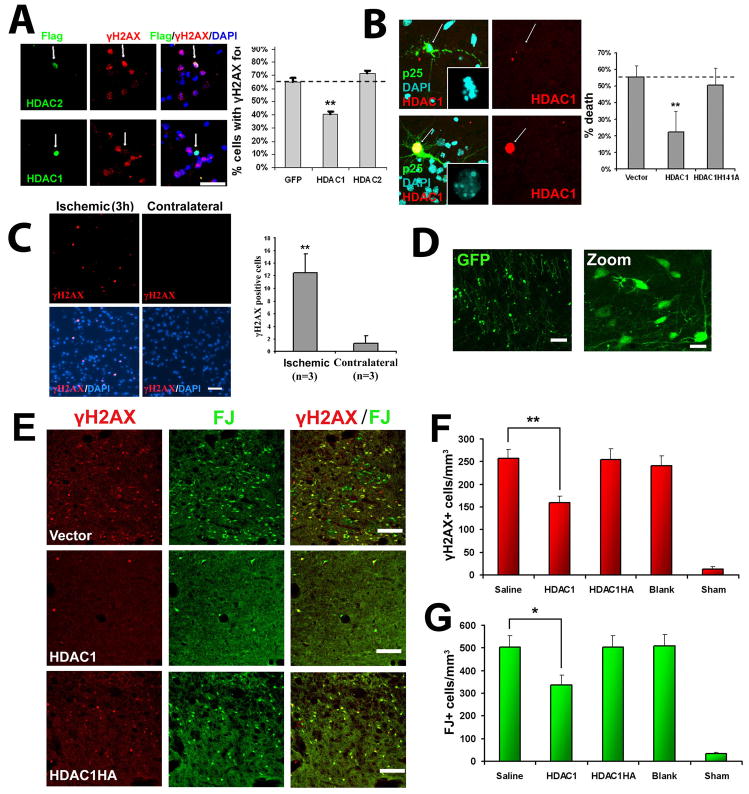
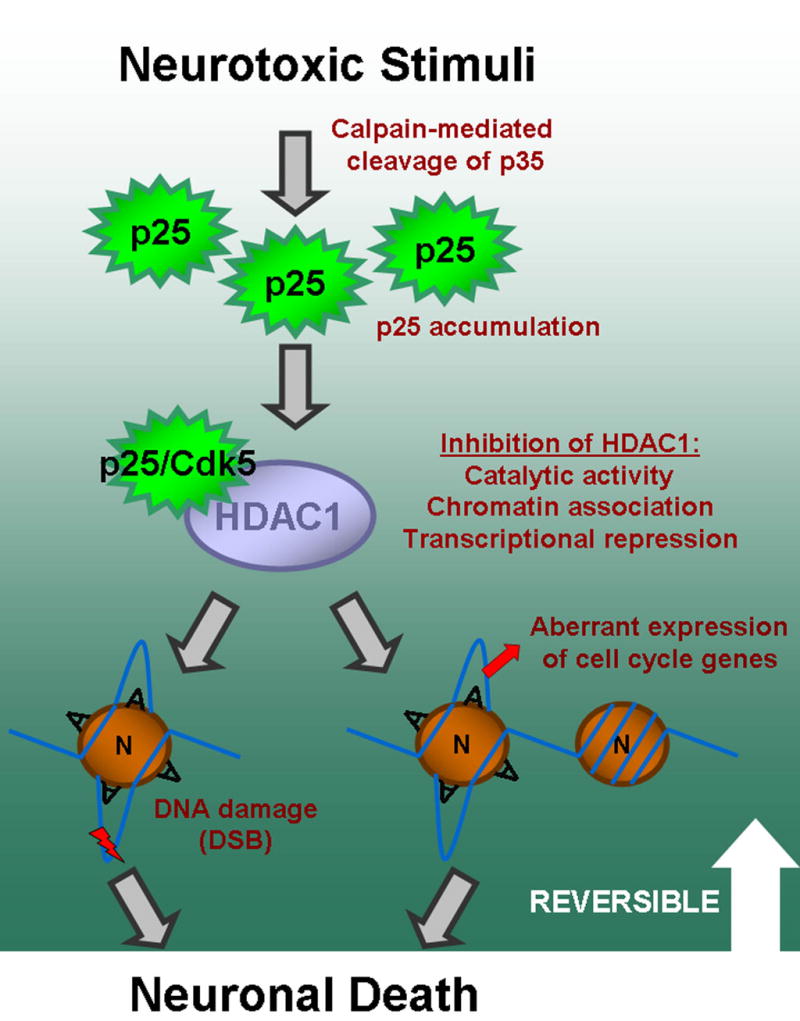
Aberrant cell-cycle activity and DNA damage are emerging as important pathological components in various neurodegenerative conditions. However, their underlying mechanisms are poorly understood. Here, we show that deregulation of histone deacetylase 1 (HDAC1) activity by p25/Cdk5 induces aberrant cell-cycle activity and double-strand DNA breaks leading to neurotoxicity. In a transgenic model for neurodegeneration, p25/Cdk5 activity elicited cell-cycle activity and double-strand DNA breaks that preceded neuronal death. Inhibition of HDAC1 activity by p25/Cdk5 was identified as an underlying mechanism for these events, and HDAC1 gain of function provided potent protection against DNA damage and neurotoxicity in cultured neurons and an in vivo model for ischemia. Our findings outline a pathological signaling pathway illustrating the importance of maintaining HDAC1 activity in the adult neuron. This pathway constitutes a molecular link between aberrant cell-cycle activity and DNA damage and is a potential target for therapeutics against diseases and conditions involving neuronal death.


Figures

Figure 1
Figure 1. Cell cycle markers are aberrantly upregulated following p25 induction
(A) Hippocampi from 2 week-induced CK-p25 mice and WT mice were subjected to total RNA extraction, reverse transcription, and semi-quantitative PCR analyses as described. A representative blot of mRNA levels of various cell cycle genes from CK-p25 and WT hippocampi at 20, 25, and 30 cycles of semiquantitative RT-PCR are shown on the left. Quantifications from multiple animals are displayed in the histogram on right. Band quantifications were normalized to actin levels. Data is displayed as average ±S.E as fold increase over WT, with WT samples set to 1. P values (*p<0.05) were calculated from multiple animals by two-tailed, unpaired Student’s t-test. (B) Forebrains from 2-week induced CK-p25 mice and WT controls were analyzed for PCNA, cyclinA, and E2F-1 protein levels. Glial fibrillary acidic protein (GFAP), or BetaIII-tubulin, used as loading control, were unchanged. (C) Ki-67, a cell cycle progression marker, is upregulated in p25-expressing neurons in CK-p25 brains (top panels), but not in neurons of WT controls (bottom panels). CA1 region is shown. (D) Proliferating cell nuclear antigen (PCNA), a proliferation/S-phase marker, is induced in p25-expressing neurons in CK-p25 brains (top panels), but not in neurons of WT controls (bottom panels). CA1 region is shown. (E) p25-expressing neurons in CK-p25 brains are not immunoreactive for the mitotic marker phospho(pS10)-Histone H3 (top panels). Subventricular zone (SVZ) of the same CK-p25 brain is shown as a positive control for mitotic cells which display phospho-Histone H3 immunoreactivity. Scale bar = 50 μm.
Figure 2
Figure 2. Double-strand DNA damage occurs following p25 induction
(A) Western blots from induced CK-p25 mice forebrain lysates show increased levels of γH2AX and Rad51 compared to WT controls. Asterisk indicates nonspecific band. Quantification of γH2AX levels (±S.D.) from multiple WT controls (n=5) and CK-p25 mice (n=5) induced between 2 and 12 weeks are shown in top panel. (B) Staining of vibratome sections with γH2AX reveals immunoreactivity specifically in the nuclei of p25-GFP-expressing neurons in two-week induced CK-p25 mice (top panels) but not in neurons of WT controls (bottom panels). CA1 region is shown. Inset is a magnification of γH2AX signal showing punctate nuclear staining. Scale bar = 50μM. (C) Primary cortical neurons were infected with increasing titers of herpesvirus expressing p25 (p25-HSV) or lacZ-HSV control and analyzed for γH2AX levels by Western blot. (D) Primary cortical neurons infected with p25-HSV and fixed 8 hours post-infection display robust immunoreactivity with γH2AX (right panels), compared to control uninfected neurons (left panels). p25 overexpression was verified with p35 antibody (top panels). Top and bottom panels are from different fields. (E) Comet assays were carried out on primary neurons infected with p25-HSV or lacZ-HSV for 10 hours. Representative micrographs of comet assay fields are shown in the left and middle panels for p25-HSV infected and lacZ-HSV infected neurons, respectively. Comet tails indicate DNA with breaks, resulting in increased migration towards the direction of the current (left to right). Right panel shows quantification of the percentage of neurons with comet tails from three separate experiments. Results are displayed as fold change to control (lacZ-HSV infected) neurons. P-values (**p<0.005) were calculated from multiple experiments by two-tailed, unpaired Student’s t-test.
Figure 3
Figure 3. Double-strand DNA breaks and aberrant cell cycle activity are concomitant and precede neuronal death
(A) Double immunoflourescence staining for Ki-67 (green) and γH2AX (red) carried out in 2 week induced CK-p25 mice revealed that cell cycle reentry and DNA double-strand breaks occur concurrently. Representative images of CA1 region is shown in left panels, and quantification of neurons immunoreactive for both γH2AX and Ki-67, γH2AX only, or Ki-67 only from multiple 2 week induced CK-p25 mice are shown in the histogram. a: γH2AX+Ki-67 vs γH2AX only, p<0.001; b: γH2AX+Ki-67 vs Ki-67 only, p<0.001. One way ANOVA with Neuman-Keuls multiple comparison test. (B) γH2AX and Ki-67 are closely associated with dying neurons at 8 weeks of p25 induction. A representative image showing association of γH2AX and Ki-67 with pyknotic nuclei (first, second, and third panels). Fourth panel is a magnification of the boxed region in third panel. Quantification of cell death (pyknotic nuclei) in p25-GFP and γH2AX immunoreactive neurons, p25-GFP and Ki-67 immunoreactive neurons, or neurons immunoreactive for p25-GFP but not γH2AX or Ki-67 are shown from multiple 2-week induced and 8-week induced CK-p25 mice. a: p25 only vs p25+ γH2AX, p<0.01; b:p25 only vs p25+Ki-67, p<0.01. One way ANOVA with Neuman-Keuls multiple comparison test. (C) CK-p25 mice were induced for 2 weeks (top panels) and sacrificed, or induced for 2 weeks followed by 4 weeks of suppression through doxycyline diet prior to sacrifice. Sections were examined for GFP and γH2AX signals. It was previously determined that 2 week induction of p25 followed by 4 weeks of suppression did not result in neuronal loss (Fischer et al., 2005). Scale bar = 100 μM.
Figure 4
Figure 4. p25 interacts with HDAC1 and inhibits its activity
(A) Forebrains from 2-week induced CK-p25 and WT control mice were homogenized and lysates immunoprecipitated with HDAC1 antibody as described, and probed for p25-GFP and HDAC1. (B) Flag-tagged HDAC1 was overexpressed with GFP-p25 or p35 in HEK293T cells, immunoprecipitated with flag-conjugated beads as described, and probed for p25-GFP or p35-GFP. (C) Flag-tagged full length HDAC1 or various truncation mutations were overexpressed with GFP-p25 and immunoprecipitated with flag-conjugated beads as described. The catalytic domain is indicated in brown. (D) Left panel: HEK293T cells were transfected with vector or with p25/Cdk5. 15 hours later, endogenous HDAC1 was immunoprecipitated then assayed for histone deacetylase activity as described. Averages from multiple experiments are displayed as fold change over control (vector only). Right panel: hippocampi from 2 week-induced WT and CK-p25 mice were dissected and assayed for endogenous HDAC1 activity as described. P-values (**p<0.005, *p<0.05) were calculated from multiple experiments by two-tailed, unpaired Student’s t-test. (E) p25/Cdk5 inhibits the transcriptional repressor activity of HDAC1. HDAC1-Gal4 construct was cotransfected with blank vector or p25/Cdk5 then measured for luciferase reporter activity as described. Values were normalized to protein levels of Gal4 constructs, and are expressed as relative light units (HDAC1-Gal4 only = 1). (F) Primary cortical neurons were infected with p25-HSV or GFP-HSV then subjected to fractionation as described. Lamin A and Histone 3 are used as markers for the nuclear and chromatin fractions, respectively. Band densitometry quantifications from multiple experiments (±S.D.) are shown in the histogram on the right. (G) HEK293T cells were transfected with blank vector or p25 and Cdk5, cross-linked, then subjected to chromatin immunoprecipitation using HDAC1 or acetylated Histone 3 at Lysine 9 (acetylH3K9) antibody. Immune complexes were subjected to semi-quantitative PCR amplification using primers towards the core promoter regions of E2F-1 and p21/WAF.
Figure 5
Figure 5. Loss of HDAC1 or pharmacological inhibition of HDAC1 results in DNA damage, cell cycle reentry, and neurotoxicity
(A,B) Primary cortical neurons were transfected with either HDAC1 siRNA or random sequence siRNA, along with GFP at a 7:1 ratio to label transfected neurons. Cells were fixed at 24h, 48h, and 72h post-transfection and immunostained for γH2AX. GFP-positive neurons were scored for γH2AX immunoreactivity and for cell death based on nuclear condensation and neuritic integrity, as described. (A) Representative micrographs. HDAC1 siRNA or control (random sequence) siRNA transfected neurons are indicated by arrows. The HDAC1 siRNA transfected neurons display neuritic breakage. The inset is a magnification of the γH2AX staining of the neuron indicated by arrow and asterisk, showing γH2AX foci of varying sizes. Percentage of γH2AX and cell death are shown as averages from multiple sets ±S.D. It was noted that transfection of control siRNA per se appeared to cause a low but significant baseline level of γH2AX immunoreactivity and cell death. (B) Primary cortical neurons were treated with 1μM of the HDAC1 inhibitor MS-275 for 24h, fixed, and immunostained for γH2AX and Ki-67. Controls were treated with equal amounts of vehicle (DMSO). Total numbers of γH2AX and Ki-67 positive neurons were quantified over 20 microscope fields (field diameter ~900 μm). Scale bar = 100 μm. (C) Wild-type mice were injected intraperitoneally with 50mg/kg MS-275 (n=3) or saline (n=3) daily for 10 days, then sacrificed and examined for γH2AX. MS-275 injection resulted in a dramatic induction of γH2AX within the CA1 (bottom panels), whereas saline injection did not induce γH2AX (top panels). Scale bar = 100μM.
Figure 6
Figure 6. HDAC1 gain-of-function rescues against p25-mediated double-strand DNA breaks and neurotoxicity
(A) Overexpression of HDAC1 rescues against p25 mediated formation of γH2AX. Primary cortical neurons were transfected with vector, HDAC1, or HDAC2 as described. At 12 hours posttransfection, neurons were infected with p25-HSV virus, fixed after 8 hours, and immunostained for γH2AX. HDAC-positive cells were scored for immunoreactivity towards γH2AX. (B) Overexpresson of HDAC1 rescues against p25-mediated neurotoxicity. Primary cortical were transfected with p25-GFP plus blank vector, flag-HDAC1, or catalytic dead flag-HDAC1-H141A mutant. At 24h posttransfection, cells were fixed and immunostained for flag. p25 transfected cells and p25/HDAC1 transfected cells were scored for cell death based on nuclear condensation and neuritic integrity as described. For (A) and (B), averages from multiple experiments ±S.D. are shown. Representative micrographs for HDAC1 are shown on left panels. Arrows indicate p25-positive neurons expressing or not expressing HDAC1. P-values (HDAC1 vs control, **p<0.005) were calculated from multiple experiments by two-tailed, unpaired Student’s t-test. Bar= 50 μM. (C) Adult Sprague-Dawley rats were subjected to unilateral middle cerebral artery occlusion (MCAO) as described. Paraffin sections from brains fixed at three hours post-MCAO show γH2AX immunoreactivity specifically within the ischemic area (left panels) but not in the contralateral area (right panels). Images are representative of multiple animals. Average numbers of γH2AX-positive cells per field (field diameter ~900μm) from multiple experiments ±S.D. are displayed. 20 fields were counted per experiment. P-values (**p<0.005) were calculated from multiple experiments by two-tailed, unpaired Student’s t-test. (D) Injection of blank vector (expressing GFP) into striatum results in efficient and widespread expression in striatal neurons. Injection of virus into the striatum of adult Sprague-Dawley rats was followed examination of GFP expression after 24 hours. Left pane bar = 100μM, right panel bar = 30μM. (E) HDAC1 expression protects against ischemia-induced neuronal death and γH2AX formation in vivo. Adult Sprague-Dawley rats were injected with virus in the striatum, subjected to bilateral transient forebrain ischemia after 24 hours, then examined 6 days later for Fluoro-Jade and γH2AX staining as described. Representative images from mice injected with HSV-HDAC1, HSV-HDAC1H141A, and blank HSV (Vector) are shown. Scale bar = 100μM. (F) Quantification of γH2AX+ cells from mice injected with saline, HSV-HDAC1, HSV-HDAC1H141A, vector, or mice subjected to sham procedure are shown. (G) Quantification of FJ+ cells from the same mice as (F). For (F) and (G), Data is presented as Mean ± SEM. P-values (*p<0.05; **p<0.005) were calculated from multiple experiments by two-tailed, unpaired Student’s t-test. Bar = 100μM.
Figure 7
Figure 7. Schematic model
Proposed model for p25-mediated cell death involving inhibition of HDAC1 activity which leads to DNA double-strand breaks and aberrant cell cycle activity. Neurotoxic stimuli such as ischemia results in p25 accumulation. This accumulation results in interaction with and inhibition of multiple aspects of HDAC1 activity, as shown in Figure 4, in a manner that is dependent on Cdk5, as shown in Figure 4E. Inhibition of HDAC1 results in DNA damage and aberrant expression of cell cycle genes which is likely associated with local histone deacetylation (Figure 5, Figure 4G, Figure S7), and which ultimately leads to neuronal death (Figure 3). The neurotoxic effects of p25 accumulation and downstream effects appear to be reversible before a certain period of induction (Figure 3C). The circle labeled ‘N’ represents nucleosome, while ‘A’ represents acetylation of histone tails. The nucleosomes with ‘A’ represent acetylated nucleosomes and open chromatin loci, while nucleosome on far right represents a deacetylated nucleosome and closed chromatin locus.

Comment in

References

    1. Adamec E, Vonsattel JP, Nixon RA. DNA strand breaks in Alzheimer’s disease. Brain Res. 1999;849:67–77. - PubMed
    1. al-Ubaidi MR, Hollyfield JG, Overbeek PA, Baehr W. Photoreceptor degeneration induced by the expression of simian virus 40 large tumor antigen in the retina of transgenic mice. Proc Natl Acad Sci U S A. 1992;89:1194–1198. - PMC - PubMed
    1. Bates GP. Huntington’s disease. Exploiting expression. Nature. 2001;413:691, 693–694. - PubMed
    1. Boutillier AL, Trinh E, Loeffler JP. Constitutive repression of E2F1 transcriptional activity through HDAC proteins is essential for neuronal survival. Ann N Y Acad Sci. 2002;973:438–442. - PubMed
    1. Boutillier AL, Trinh E, Loeffler JP. Selective E2F-dependent gene transcription is controlled by histone deacetylase activity during neuronal apoptosis. J Neurochem. 2003;84:814–828. - PubMed

Publication types

MeSH terms