. 2009 Jan;134(1):18-24.
doi: 10.1039/b807563h. Epub 2008 Oct 31.

Carbon-fiber microelectrodes for in vivo applications

Affiliations

Carbon-fiber microelectrodes for in vivo applications

Megan L Huffman et al. Analyst. 2009 Jan.

Abstract

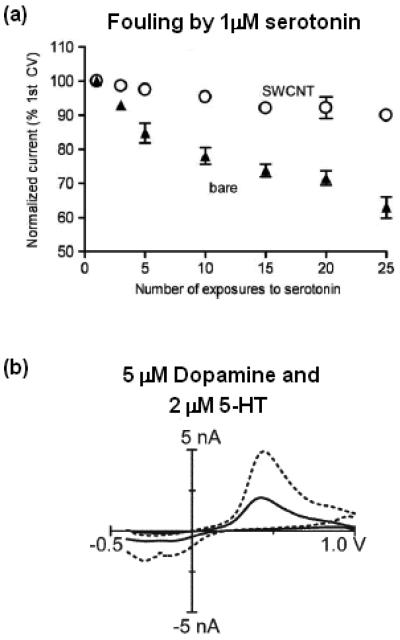
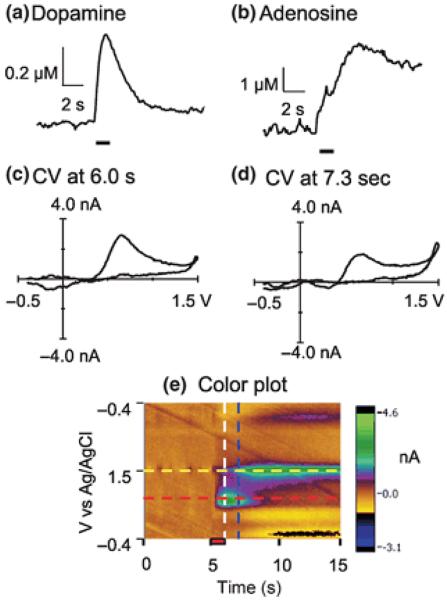
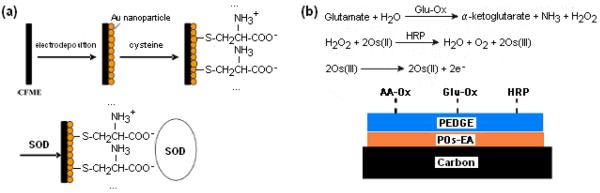
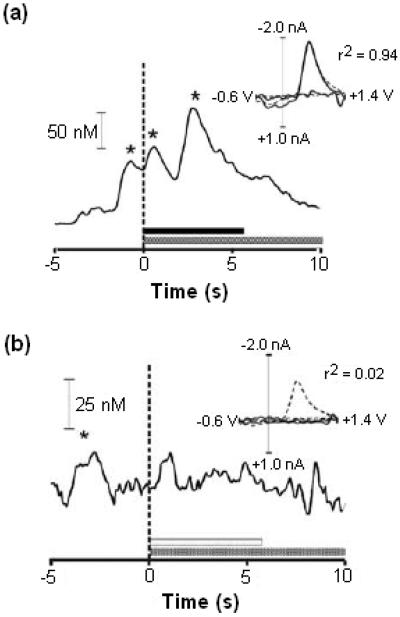
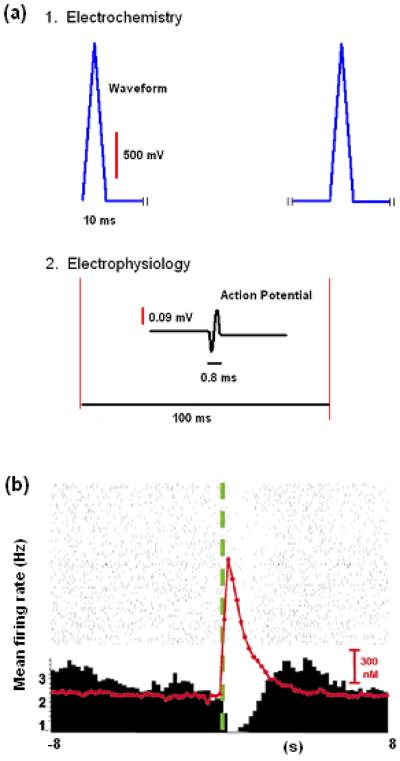
Carbon-fiber microelectrodes (CFMEs) have been a useful tool for measuring rapid changes in neurotransmitters because of their small size, sensitivity, and good electrochemical properties. In this article, we highlight recent advances using CFMEs for measuring neurotransmitters in vivo. Dopamine has been a primary neurotransmitter of interest but direct electrochemical detection of other neurochemicals including nitric oxide and adenosine has also been investigated. Surface treatments have been studied to enhance electrode sensitivity, such as covalent modification or the addition of a layer of carbon nanotubes. Enzyme-modified microelectrodes that detect non-electroactive compounds further extend the usefulness of CFMEs beyond the traditional monoamines. CFMEs continue to be used in vivo to understand basic neurobiological mechanisms and the actions of pharmacological agents, including drugs of abuse. Advances in sensitivity and instrumentation now allow CFMEs to be used for measurements of natural dopamine release that occur during behavioral experiments. A new technique combining electrochemistry with electrophysiology at a single microelectrode facilitates a better understanding of neurotransmitter concentrations and their effects on cell firing. Future research in this field will likely concentrate on fabricating smaller electrodes and electrode arrays, as well as expanding the use of CFMEs in neuroscience beyond dopamine.


Figures

Figure 1
Figure 1
The Venton lab used carbon nanotube-modified CFMEs for measurement of serotonin and dopamine. (a) Effects of nanotubes on fouling of the electrode by serotonin. Bare electrodes (▲) have a larger decrease in current after repeated exposure to serotonin (5-HT) than single-walled carbon nanotube-modified electrodes (SWCNT, ○), showing that carbon nanotubes protect the electrode from fouling. Reproduced from Figure 6 of Reference (Copyright 2007, The Royal Society of Chemistry, U.S.A.) (b) Detection of 2 μM serotonin and 5 μM dopamine simultaneously in vitro. The carbon nanotube-modified electrode (dotted line) shows two reduction peaks, which allow the differentiation of dopamine and serotonin more easily than at a bare electrode (solid line). Reproduced from Figure 2 of Reference (Copyright 2007, The Royal Society of Chemistry, U.S.A.).
Figure 2
Figure 2
Measurement of electrically-stimulated dopamine and adenosine in the striatum of anesthetized rats using CFMEs. (a) Concentration profile for dopamine, taken at 0.6V, the oxidation potential for dopamine (located at the red dashed line in the color plot (e)). (b) Concentration profile for adenosine, taken at 1.5V, the oxidation potential for adenosine (yellow dashed line in the color plot). Note that adenosine release is slower and lasts longer following stimulation than that of dopamine. (c) A cyclic voltammogram (CV) taken at 6 seconds (white dashed line on the color plot), showing primarily dopamine. (d) A CV taken at 7.3 seconds (blue dashed line on the color plot), showing a mixture of adenosine and dopamine. (e) Color plot represents all of the data, with scanned voltage on the y-axis, time on the x-axis and current in false color. Reproduced from Figure 2 of Reference (Copyright 2008, S. Cechova and B.J. Venton).
Figure 3
Figure 3
Enzyme-modified carbon-fiber microelectrodes. (A) The Ohsaka lab developed a superoxide anion biosensor. First, gold nanoparticles were electrodeposited onto the carbon fiber. Next, the gold nanoparticles were modified with cysteine, which was then used to immobilize superoxide dismutase (SOD) onto the electrode. Direct electron transfer between the SOD and the carbon fiber allowed for detection of superoxide anion. Adopted from Scheme 1 Reference (Copyright 2004 Elsevier B.V.). (B) The Westerink lab developed a glutamate sensor. Ascorbate oxidase (AA-Ox), glutamate oxidase (Glu-Ox) and horseradish peroxidase (HRP) were immobilized onto poly(ethyleneglycol) diglycidyl ether (PEDGE). PEDGE acts as a cross-linker to bind the enzymes to an osmium-containing redox polymer (Pos-EA). Glutamate is detected by a cascade of enzymatic reactions that produce osmium(III) which can be oxidized at the carbon surface. AA-Ox is included in the sensor to circumvent the action of ascorbate, which can interfere with the cascade by reducing Os(III), oxidized HRP or H2O2.
Figure 4
Figure 4
Carbon-fiber microelectrodes are used to study dopamine release during operant behavior. (A) Freely-moving rats were given an i.v. dose of cocaine (horizontal black bar) when they pressed a lever (vertical dashed line at time = 0). Dopamine levels rose when the rats were presented with the lever (first asterisk), and again when cocaine was administered (second and third asterisks). Researchers gave the rats a drug-related cue when the lever was pressed and cocaine provided (horizontal gray line). The voltammogram insert confirms dopamine is detected by comparing behaviorally evoked release (black line) to electrically evoked release (dotted line). (B) When the rats were given a saline infusion in response to pressing the lever, there is no rise in dopamine levels. There is, however, a rise in dopamine when the rats are presented with the lever. This indicates that dopamine is involved in anticipatory behavior. Adapted from figures 3 and 4 of reference (Copyright 2005 Elsevier).
Figure 5
Figure 5
Electrochemistry combined with electrophysiology experiment. (a) Schematic of the timing of the experiment. The electrode voltage is ramped for cyclic voltammetry every 100 ms. Between ramps, the potential waveform is disconnected (represented by railroad tracks) and an electrophysiology experiment is performed by measuring voltage changes due to nearby cell firing. Action potentials are monitored and the rate of firing over a given time period is calculated. (b) Example of experimental data collected from an intercranial self-stimulation (ICS) experiment. The red line represents the average dopamine concentration elicited when an animal pressed a lever for a rewarding stimulation. The green dashed line shows when the lever press occurred. The histogram shows mean firing rates for neural activity determined from the electrophysiological data. The data above the histogram shows a tick for every action potential detected from 24 different lever presses (each on a vertical line). When ICS takes place, there is a transient increase in dopamine levels and a transient decrease in neuronal firing frequency. (b) was reproduced from Figure 1 of Reference (Copyright 2005 National Academy of Sciences, U.S.A.).

References

    1. Ponchon JL, Cespuglio R, Gonon F, Jouvet M, Pujol JF. Anal.Chem. 1979;51:1483–1486. - PubMed
    1. Michael AC, Wightman RM. Laboratory Techniques in Electroanalytical Chemistry. Marcel Dekker; New York: 1996. pp. 367–402. Chapter 12.
    1. Ewing AG, Dayton MA, Wightman RM. Analytical Chemistry. 1981;53:1842–1847.
    1. Sasakawa N, Murayama N, Kumakura K. Cellular and Molecular Neurobiology. 2005;25:777–787. - PMC - PubMed
    1. Gratton A, Hoffer BJ, Gerhardt GA. Neuroscience. 1989;29:57–64. - PubMed

Publication types