Polymorphisms near SOCS3 are associated with obesity and glucose homeostasis traits in Hispanic Americans from the Insulin Resistance Atherosclerosis Family Study
- PMID: 19083014
- PMCID: PMC2804661
- DOI: 10.1007/s00439-008-0608-3
Polymorphisms near SOCS3 are associated with obesity and glucose homeostasis traits in Hispanic Americans from the Insulin Resistance Atherosclerosis Family Study
Abstract
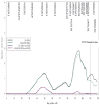
The SOCS3 gene product participates in the feedback inhibition of a range of cytokine signals. Most notably, SOCS3 inhibits the functioning of leptin and downstream steps in insulin signaling after being expressed by terminal transcription factors, such as STAT3 and c-fos. The SOCS3 gene is located in the chromosome region 17q24-17q25, previously linked to body mass index (BMI), visceral adipose tissue (VAT), and waist circumference (WAIST) in Hispanic families in the Insulin Resistance Atherosclerosis Family Study (IRASFS). A high density map of 1,536 single nucleotide polymorphisms (SNPs) was constructed to cover a portion of the 17q linkage interval in 1,425 Hispanic subjects from 90 extended families in IRASFS. Analysis of this dense SNP map data revealed evidence of association of rs9914220 (located 10 kb 5' of the SOCS3 gene) with BMI, VAT, and WAIST (P-value ranging from 0.003 to 0.017). Using a tagging SNP approach, rs9914220 and 22 additional SOCS3 SNPs were genotyped for genetic association analysis with measures of adiposity and glucose homeostasis. The adiposity phenotypes utilized in association analyses included BMI, WAIST, waist to hip ratio (WHR), subcutaneous adipose tissue, VAT, and visceral to subcutaneous ratio (VSR). Linkage disequilibrium calculations revealed three haplotype blocks near SOCS3. Haplotype Block 3 (5' of SOCS3) contained SNPs consistently associated with BMI, WAIST, WHR, and VAT (P-values ranging from 2.00 x 10(-4) to 0.036). Haplotype Block 1 contained single-SNPs that were associated with most adiposity traits except for VSR (P-values ranging from 0.002 to 0.047). When trait associated SNPs were included in linkage analyses as covariates, a reduction of VAT LOD score from 1.26 to 0.76 above the SOCS3 locus (110 cM) was observed. Multi-SNP haplotype testing using the quantitative pedigree disequilibrium test was broadly consistent with the single-SNP associations. In conclusion, these results support a role for SOCS3 genetic variants in human obesity.
Figures


References
-
- Norris JM, Langefeld CD, Scherzinger AL, et al. Quantitative trait loci for abdominal fat and BMI in Hispanic-Americans and African-Americans: the IRAS Family Study. Int J Obes (Lond) 2005;29:67–77. - PubMed
-
- Sutton BS, Langefeld CD, Campbell JK, et al. Genetic mapping of a 17q chromosomal region linked to obesity phenotypes in the IRAS family study. Int J Obes (Lond) 2006;30(9):1433–1441. - PubMed
-
- Coppari R, Ichinose M, Lee CE, et al. The hypothalamic arcuate nucleus: a key site for mediating leptin’s effects on glucose homeostasis and locomotor activity. Cell Metab. 2005;1(1):63–72. - PubMed
-
- Munzberg H, Myers MG., Jr Molecular and anatomical determinants of central leptin resistance. Nat Neurosci. 2005;8(5):566–570. - PubMed
-
- Howard JK, Flier JS. Attenuation of leptin and insulin signaling by SOCS proteins. Trends Endocrinol Metab. 2006;17(9):365–371. - PubMed
Publication types
MeSH terms
Substances
Grants and funding
LinkOut - more resources
Full Text Sources
Medical
Miscellaneous

