. 2009 Feb;215(2):358-67.
doi: 10.1016/j.expneurol.2008.11.003. Epub 2008 Nov 21.

Toxicokinetics and toxicodynamics of paraquat accumulation in mouse brain

Affiliations

Toxicokinetics and toxicodynamics of paraquat accumulation in mouse brain

Kavita Prasad et al. Exp Neurol. 2009 Feb.

Abstract

Paraquat (PQ) is a potential human neurotoxicant and is used in models of oxidative stress. We determined the toxicokinetics (TK) and toxicodynamics (TD) of PQ in adult mouse brain following repeated or prolonged PQ exposure. PQ accumulated in different brain regions and reached a plateau after approximately 18 i.p. (10 mg/kg) doses and resulted in modest morbidity and mortality unpredictably associated with dose interval and number. PQ had divergent effects on horizontal locomotor behavior depending on the number of doses. PQ decreased striatal dopamine levels after the 18th to 36th i.p. dose (10 mg/kg) and reduced the striatal level of tyrosine hydroxylase. Drinking water exposure to PQ (0.03- 0.05 mg/ml) did not result in any mortality and resulted in concentration and time dependent levels in the brain. The brain half-life of PQ varied with mouse strain. PQ accumulates and may saturate a site in mouse brain resulting in complex PQ level and duration-related consequences. These findings should alter our risk assessment of this compound and demonstrate a useful, but complex dynamic model for understanding the consequences of PQ in the brain.


Conflict of interest statement

There were no competing financial interests in this work.

Figures

Fig. 1
Fig. 1
Changes in body weight for the two saline and two PQ groups treated either 2× or 3×/week for 24 total doses in experiment I (n = 10/group initially). There was no difference in weight gain comparing the two saline groups (A) or the two PQ groups (B) up to the time of sacrifice for the 3×/wk group (~120 days). There was a statistical difference in PQ versus saline treatment which was observed only at a later age when dosed 2×/week (D), but not observed with 3×/week (C). Symbols: ● — PQ 2×/week, ○ — PQ 3×/week, ■ — saline 2×/week, □ — saline 3×/week.
Fig. 2
Fig. 2
Level of PQ in brain regions. In Experiment I ( formula image) PQ was measured in striatal samples after 6 (n = 4), 12 (n = 4), 18 (n = 4), or 24 (n = 8) (10 mg/kg) doses. There were no differences between the levels of PQ measured after dosing 2×or 3×/week and were combined. In Experiment II, the PQ level in striatum (n = 4, formula image) was measured after a total of 7, 12, 18, 24, 30, and 36 (10 mg/kg) doses. PQ was also measured after the indicated number of doses from frontal cortex (n = 2, formula image), hippocampus (n = 4, formula image), and cerebellum (n = 4, formula image). Symbols without an error bar are the population mean and error bars indicate the s.e.m. Samples from the striatum in Experiments I and II, frontal cortex, cerebellum, and hippocampus were extracted and analyzed at different times.
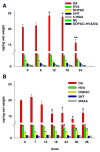
Fig. 3
Fig. 3
Total horizontal activity counts. Mice were allocated to different groups after the third habituation (A) and then treated with either PQ or saline 2× or 3×/week (n = 9–10/group) (B–D). No difference was seen in behavior related to treatment frequency so the groups were combined for statistical analysis, but were plotted separately. Activity differed between groups over the course of treatments immediately after the indicated doses (B), but not 24 h later (C). Mice treated with PQ were also significantly more active 7 days after the final treatment and prior to sacrifice (D). * indicate significant differences between PQ and saline following post-hoc testing.
Fig. 4
Fig. 4
Striatal levels of dopamine (DA), homovanillic acid (HVA), 3, 4-dihydroxyphenylacetic acid (DOPAC), serotonin (5-HT), 5-hydroxyindoleacetic acid (5-HIAA) were determined using HPLC in striatal samples 7 days after the indicated doses of PQ. A. The 2×(n = 4) and 3×(n = 4)/week treatments were combined as no significant differences were observed between these groups. Post-hoc testing revealed either a modestly significant increase in DA 7 days after the 12th and 18th doses of PQ compared to saline (**) or a significant decrease in DA after the 24th dose compared to all other groups (*). B. Post-hoc testing demonstrated significant declines in DA after 18 or more doses of PQ, significant declines in HVA after 24 or more doses of PQ, and significant increases in DOPAC after 30 or more doses of PQ compared to saline (*).
Fig. 5
Fig. 5
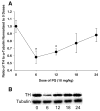
Changes in the abundance of striatal TH after the indicated doses. Samples sizes (n) for the different doses of PQ were 0 (10), 6 (8), 12 (7), 18 (5), and 24 (8) as limited by tissue availability. Samples included a similar number of 2× and 3×/week doses of PQ and saline. (A) Plot of the ratio of densitometric values for TH to α-tubulin at the indicated number of doses. Values indicated by * were significantly different following appropriate post-hoc tests compared to 0 doses of PQ (saline control group). (B) Representative image of TH and α-tubulin at indicated number of doses of PQ.
Fig. 6
Fig. 6
Mice (n = 24) were randomly assigned to one of six groups (n = 4 per group). There were 3 drinking water exposure concentrations: low (~0.03 mg/ml), medium (~0.04 mg/ml), and high (~0.05 mg/ml) for either 8 or 12 weeks. Weights were measured prior to and during PQ exposure. Errors bar are smaller for the first 8 weeks of PQ exposure because of a larger sample size. Mice gained weight following all exposures.
Fig. 7
Fig. 7
The level of PQ was measured in the striatum following low (0.03 mg/ml), medium (0.04 mg/ml), or high (0.05 mg/ml) concentration of PQ in drinking water for 8 or 12 weeks. The sample size was 4 for each condition. The level of PQ in the brain was concentration and time dependent.
Fig. 8
Fig. 8
Time course of PQ in ventral midbrain (VM) of five different mouse strains. PQ (10 mg/kg) was injected by the intraperitoneal route and tissue harvested at different time points. At no time point was PQ entirely eliminated from brain. (Each value represents a mean from 4 mice.) Elimination followed a linear pattern over time with correlation coefficients ranging from 0.83 to 0.99 for the different strains.
Fig. 9
Fig. 9
Composite graph of effects of PQ by dose and time. Selected data from Experiment I presented in previous figures were normalized to the zero dose (saline) values (DA, HVA, TH), the habituation day 3 value (horizontal activity), or the 24th dose (PQ) to allow comparison of effects over time or dose number. PQ accumulated in a linear manner until reaching a level that may have saturated an unknown site(s) in the striatum of mouse brain between the 12th to 18th dose. The brain level of PQ was then maintained with continued exposure. DA and HVA were unaffected or minimally increased between 6 and 18 doses, but then decreased in association with the 24th dose (1 week later). TH was significantly decreased after the 6th and 12th dose and then slowly and linearly increased to near a baseline level. Horizontal activity was significantly decreased on the day of dosing after the 1st (not shown) and 6th dose of PQ and gradually increased with subsequent doses leading to significantly increased activity after the 18th and 24th doses and 1 week after the last dose (not shown).

References

    1. Barlow BK, Bennice L, Thiruchelvam MJ, Cory-Slechta DA, Ballatori N, Richfield EK. Selective dithiocarbamates increase synaptosomal dopamine content, brain concentration of paraquat and correlate with potentiation of MPTP and paraquat toxicity. J Neurochem. 2003;85:1075–1086. - PubMed
    1. Barlow BK, Kochar J, Prasad K, Buckley B, Mirochnitchenko O, Richfield EK, Thiruchelvam M. Paraquat exposure during periods of neurodevelopment and the Parkinson’s disease phenotype. Soc Neurosci Abstract Poster # 25417/M10; San Diego, CA. Session # 254, Parkinson’s Disease Models and Mechanisms II.2007.
    1. Battaglia G, Busceti CL, Pontarelli F, Biagioni F, Fornai F, Paparelli A, Brunio V, Ruggieri S, Nicolett F. Protective role of group-II metabotropic glutamate receptors against nigro-striatal degeneration induced by 1-methyl-4-phenyl-1,2,3,6-tetrahydropyridine in mice. Neuropharmacology. 2003;45:155–166. - PubMed
    1. Bowyer FJ, Tank AW, Newport GD, Slokker W, Jr, Ali SF, Holson RR. The influence of environmental temperature on the transient effects of methamphetamine on dopamine levels and dopamine release in rat striatum. J Pharmacol Exp Ther. 1992;260(2):817–824. - PubMed
    1. Bullivant CM. Accidental poisoning by paraquat: report of two cases in man. Br Med J. 1966;1:1272–1273. - PMC - PubMed

Publication types

MeSH terms