

Risperidone alters food intake, core body temperature, and locomotor activity in mice
- PMID: 19084548
- PMCID: PMC2692091
- DOI: 10.1016/j.physbeh.2008.11.011
Risperidone alters food intake, core body temperature, and locomotor activity in mice
Abstract
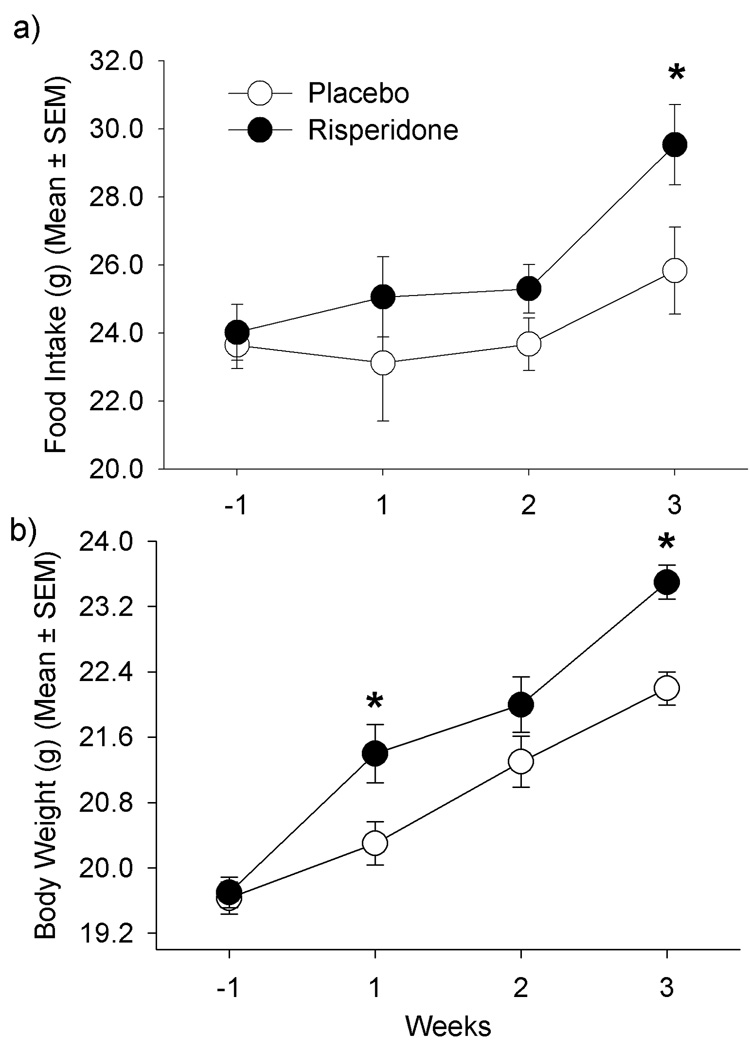
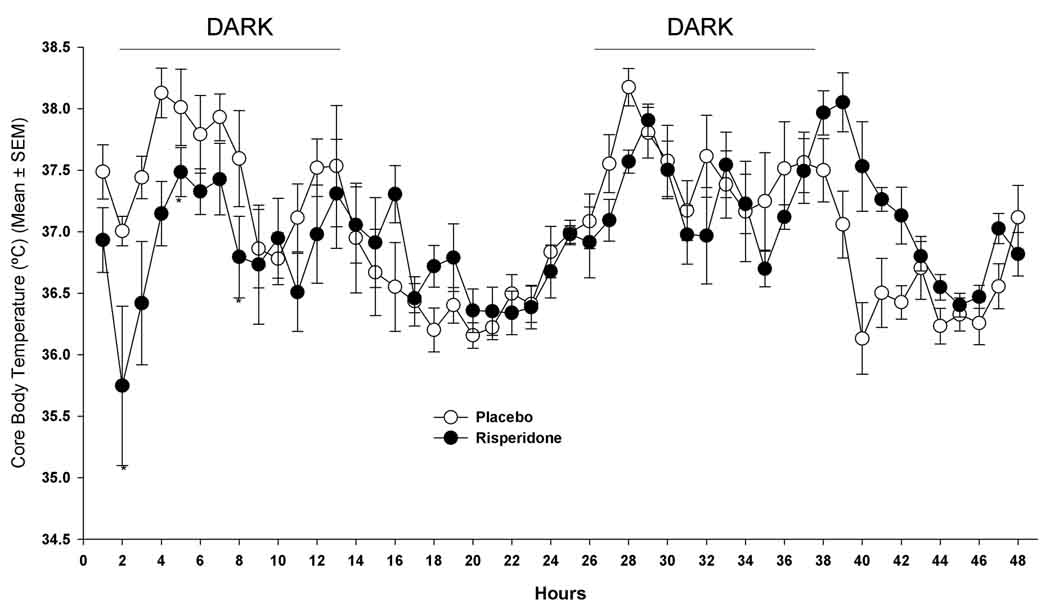
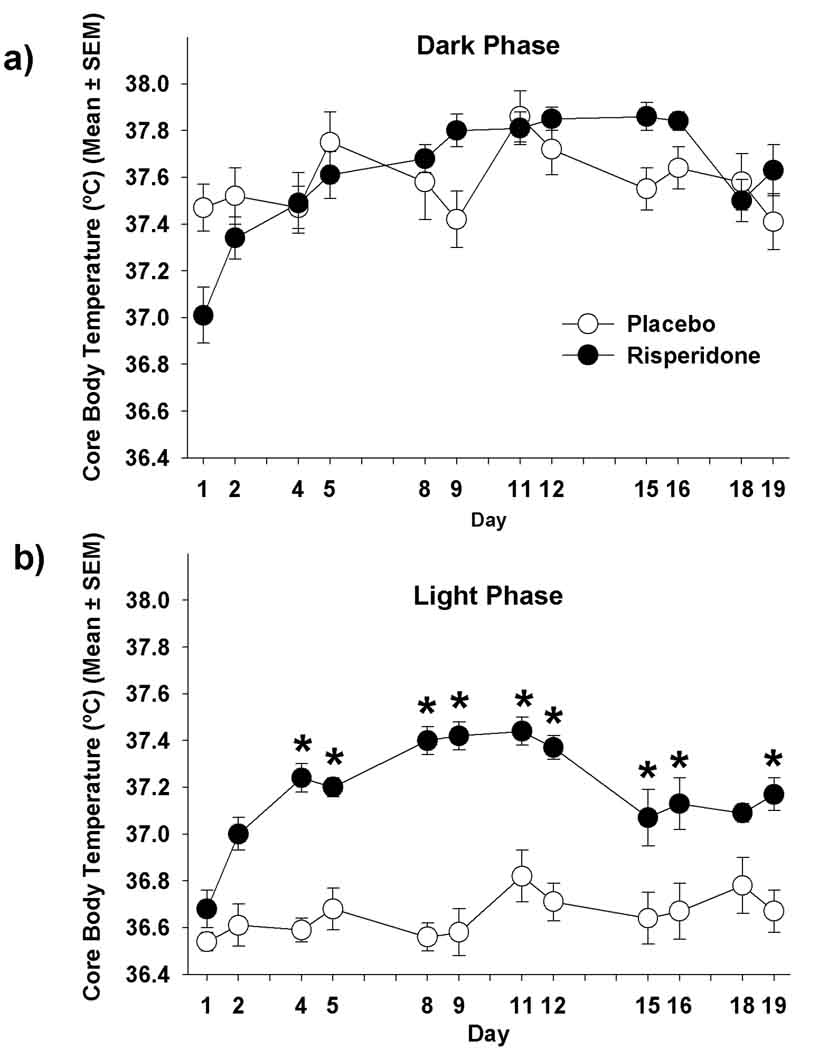
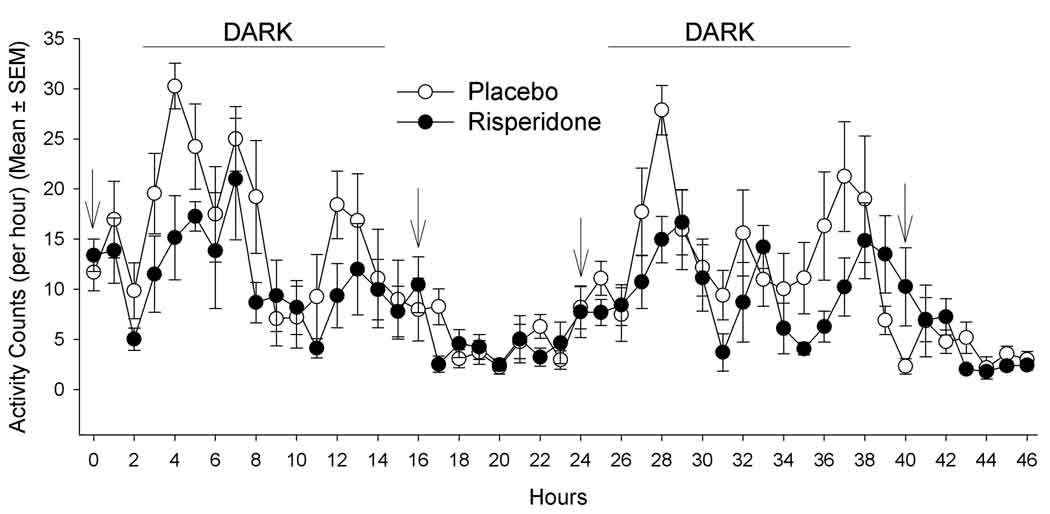
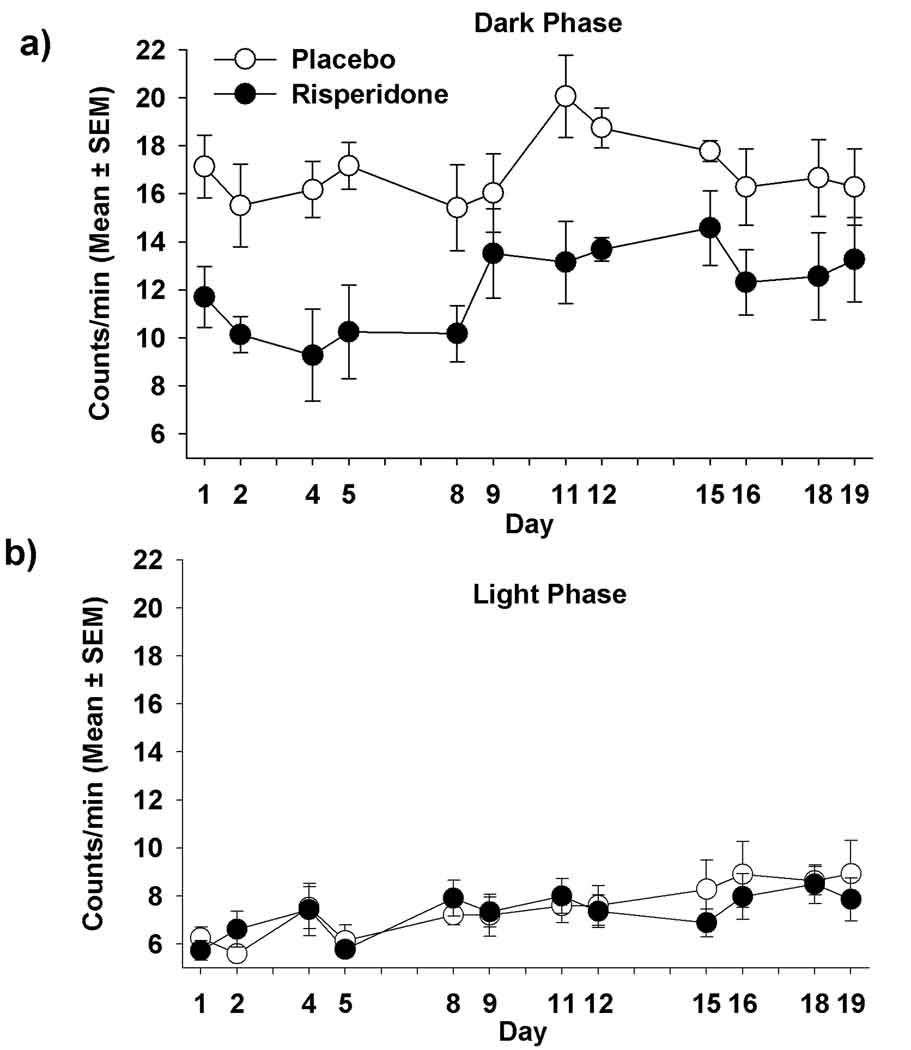
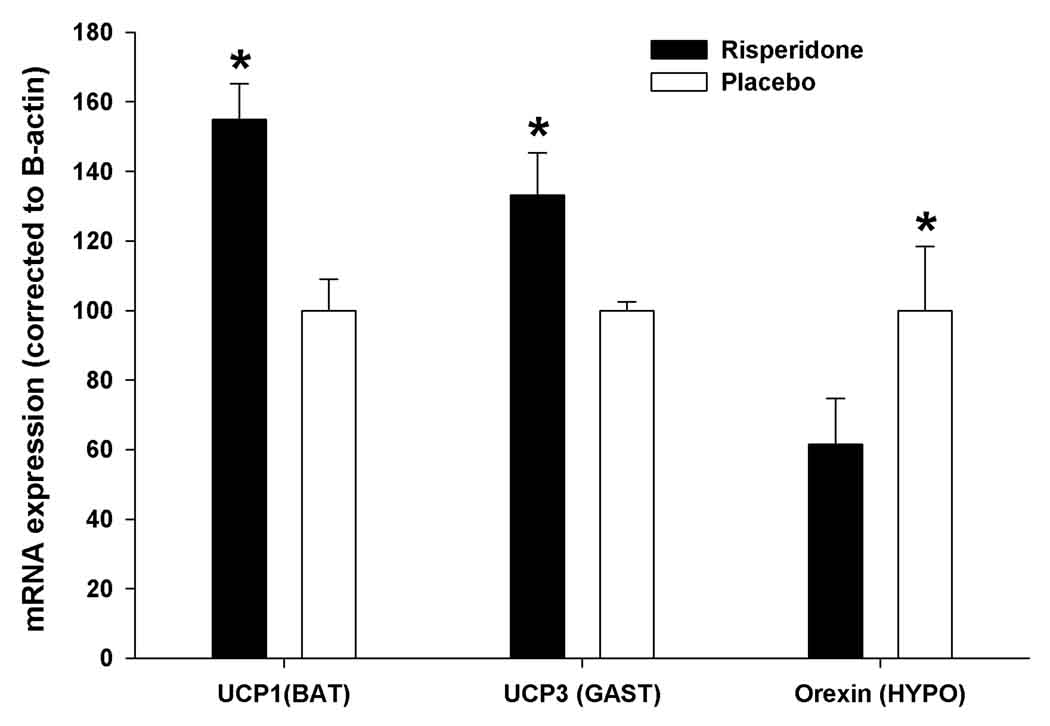
Risperidone induces significant weight gain in female mice; however, the underlying mechanisms related to this effect are unknown. We investigated the effects of risperidone on locomotor activity, core body temperature, and uncoupling protein (UCP) and hypothalamic orexin mRNA expression. Female C57BL/6J mice were acclimated to individual housing and randomly assigned to either risperidone (4 mg/kg BW day) or placebo (PLA). Activity and body temperature were measured over 48-hour periods twice a week for 3 weeks. Food intake and body weights were measured weekly. UCP1 (BAT), UCP3 (gastrocnemius), and orexin (hypothalamus) mRNA expressions were measured using RT-PCR. Risperidone-treated mice consumed more food (p=0.050) and gained more weight (p=0.0001) than PLA-treated mice after 3 weeks. During the initial 2 days of treatment, there was an acute effect of treatment on activity (p=0.046), but not body temperature (p=0.290). During 3 weeks of treatment, average core body temperatures were higher in risperidone-treated mice compared to controls during the light phase (p=0.0001), and tended to be higher during the dark phase (p=0.057). Risperidone-treated mice exhibited lower activity levels than controls during the dark phase (p=0.006); there were no differences in activity during the light phase (p=0.47). UCP1 (p<0.01) and UCP3 (p<0.05) mRNA expressions were greater in risperidone-treated mice compared to controls, whereas, orexin mRNA expression was lower in risperidone-treated mice (p<0.01). These results suggest that risperidone-induced weight gain in mice is a consequence of increased energy intake and reduced activity, while the elevation in body temperature may be a result of thermogenic effect of food intake and elevated UCP1, UCP3, and a reduced hypothalamic orexin expression.
Figures
References
-
- Horacek J, Bubenikova-Valesova V, Kopecek M, Palenicek T, Dockery C, Mohr P, Hoschl C. Mechanism of action of atypical antipsychotic drugs and the neurobiology of schizophrenia. CNS Drugs. 2006;20:389–409. - PubMed
-
- Haupt DW. Differential metabolic effects of antipsychotic treatments. Eur Neuropsychopharmacol. 2006;16(Suppl 3):S149–S155. - PubMed
-
- Baptista T, de Baptista EA, Lalonde J, Plamondon J, Kin NM, Beaulieu S, Joober R, Richard D. Comparative effects of the antipsychotics sulpiride and risperidone in female rats on energy balance, body composition, fat morphology and macronutrient selection. Prog Neuropsychopharmacol Biol Psychiatry. 2004;28:1305–1311. - PubMed
-
- Cope MB, Nagy TR, Fernandez JR, Geary N, Casey DE, Allison DB. Antipsychotic drug-induced weight gain: development of an animal model. Int J Obes (Lond) 2005;29:607–614. - PubMed
-
- Fell MJ, Marshall KM, Williams J, Neill JC. Effects of the atypical antipsychotic olanzapine on reproductive function and weight gain in female rats. J Psychopharmacol. 2004;18:149–155. - PubMed
Publication types
MeSH terms
Substances
Grants and funding
- P30 NS057098/NS/NINDS NIH HHS/United States
- P30NS057098/NS/NINDS NIH HHS/United States
- R01 DK068261/DK/NIDDK NIH HHS/United States
- T32 DK062710/DK/NIDDK NIH HHS/United States
- P30DK56336/DK/NIDDK NIH HHS/United States
- P60 DK079626/DK/NIDDK NIH HHS/United States
- P30 DK056336/DK/NIDDK NIH HHS/United States
- R01DK068261/DK/NIDDK NIH HHS/United States
- F32 DK064532/DK/NIDDK NIH HHS/United States
- T32DK062710/DK/NIDDK NIH HHS/United States
- P60DK079626/DK/NIDDK NIH HHS/United States
- F32DK064532/DK/NIDDK NIH HHS/United States
LinkOut - more resources
Full Text Sources
