. 2009 Mar;14(3):439-48.
doi: 10.1007/s00775-008-0460-x. Epub 2008 Dec 16.

Ruthenium polypyridyl complexes and their modes of interaction with DNA: is there a correlation between these interactions and the antitumor activity of the compounds?

Affiliations

Ruthenium polypyridyl complexes and their modes of interaction with DNA: is there a correlation between these interactions and the antitumor activity of the compounds?

Eva Corral et al. J Biol Inorg Chem. 2009 Mar.

Abstract

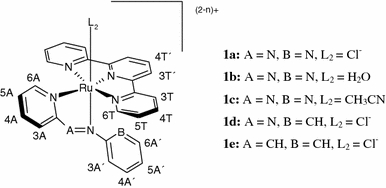
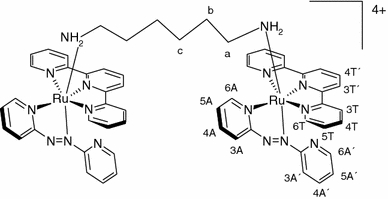
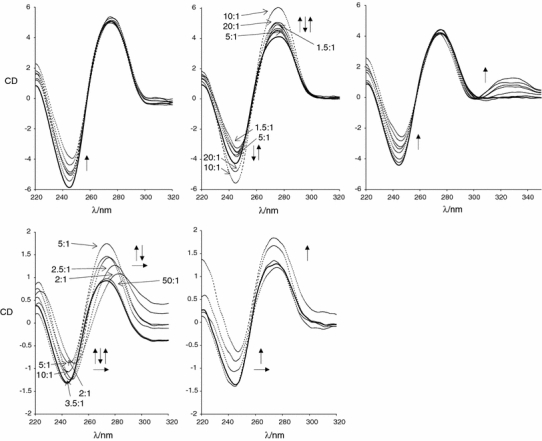
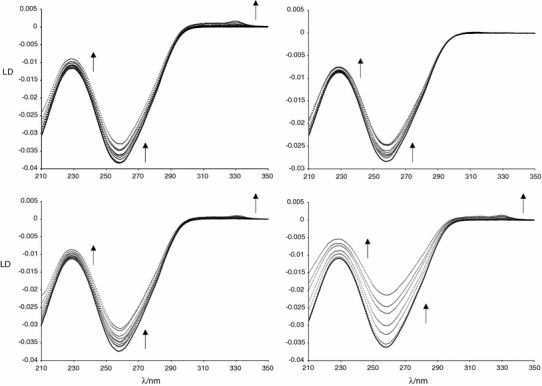
Various interaction modes between a group of six ruthenium polypyridyl complexes and DNA have been studied using a number of spectroscopic techniques. Five mononuclear species were selected with formula [Ru(tpy)L(1)L(2)]((2-n)+), and one closely related dinuclear cation of formula [{Ru(apy)(tpy)}(2){mu-H(2)N(CH(2))(6)NH(2)}](4+). The ligand tpy is 2,2':6',2''-terpyridine and the ligand L(1) is a bidentate ligand, namely, apy (2,2'-azobispyridine), 2-phenylazopyridine, or 2-phenylpyridinylmethylene amine. The ligand L(2) is a labile monodentate ligand, being Cl(-), H(2)O, or CH(3)CN. All six species containing a labile L(2) were found to be able to coordinate to the DNA model base 9-ethylguanine by (1)H NMR and mass spectrometry. The dinuclear cationic species, which has no positions available for coordination to a DNA base, was studied for comparison purposes. The interactions between a selection of four representative complexes and calf-thymus DNA were studied by circular and linear dichroism. To explore a possible relation between DNA-binding ability and toxicity, all compounds were screened for anticancer activity in a variety of cancer cell lines, showing in some cases an activity which is comparable to that of cisplatin. Comparison of the details of the compound structures, their DNA binding, and their toxicity allows the exploration of structure-activity relationships that might be used to guide optimization of the activity of agents of this class of compounds.


Figures

Fig. 1
Fig. 1
Structure of [Ru(tpy)L1L2](2−n)+ compounds (1a, 1b, 1c, 1d, 1e), where tpy is 2,2′:6′,2″-terpyridine. The proton numbering scheme for use in 1H NMR spectra is indicated as well
Fig. 2
Fig. 2
Structure of the dinuclear cation [{Ru(apy)(tpy)}2{μ-H2N(CH2)6NH2}]4+ (1f), where apy is 2,2′-azobispyridine. The proton numbering scheme for use in 1H NMR spectra is indicated as well
Fig. 3
Fig. 3
Top circular dichroism (CD) spectra of 300 μM calf-thymus DNA (ct-DNA) incubated for 24 h with increasing concentrations of the mononuclear ruthenium complexes 1b (left), 1d (center), and 1e (right). The DNA base pairs to ruthenium complex molecules ratios are 20:1, 10:1, 5:1, 3:1, 2.5:1, 2:1, and 1.5:1. Bottom CD spectra of 100 μM ct-DNA with increasing concentrations of the dinuclear complex 1f, from freshly prepared samples (left) and from samples incubated for 24 h (right). The DNA base pairs to ruthenium complex molecules ratios are 50:1, 10:1, 5:1, 3.5:1, 2.5:1, and 2:1; the last two ratios were eliminated in the incubated sample, because of precipitation. The solid line represents the ct-DNA; some of the curves are labeled with the base pairs to ruthenium complex molecules ratios. The bold arrows indicate an increase in ruthenium concentration
Fig. 4
Fig. 4
Linear dichroism spectra of 300 μM ct-DNA with increasing concentrations of the ruthenium complexes 1b (top left), 1d (bottom left), 1e (top right), and 1f (bottom right). The DNA base pairs to ruthenium complex molecules ratios are 20:1, 15:1, 10:1, 8:1, 5:1, 3.5:1, 3:1, 2.5:1, and 2:1 in the case of the mononuclear complexes (1b, 1d and 1e) and 40:1, 20:1, 15:1, 10:1, 8:1, and 6:1 for the dinuclear complex (1f). The solid line represents the ct-DNA. The arrows indicate the direction of an increase in ruthenium concentration

References

    1. Loehrer PJ, Einhorn LH. Ann Intern Med. 1984;100:704–713. - PubMed
    1. Dyson PJ, Sava G (2006) Dalton Trans 1929–1933 - PubMed
    1. Reedijk J. Curr Opin Chem Biol. 1999;3:236–240. doi: 10.1016/S1367-5931(99)80037-4. - DOI - PubMed
    1. Reedijk J. Chem Rev. 1999;99:2499–2510. doi: 10.1021/cr980422f. - DOI - PubMed
    1. Reedijk J (1996) Chem Commun 801–806

Publication types

MeSH terms