. 2009 Mar;49(3):998-1011.
doi: 10.1002/hep.22721.

Mesenchymal origin of hepatic stellate cells, submesothelial cells, and perivascular mesenchymal cells during mouse liver development

Affiliations

Mesenchymal origin of hepatic stellate cells, submesothelial cells, and perivascular mesenchymal cells during mouse liver development

Kinji Asahina et al. Hepatology. 2009 Mar.

Abstract

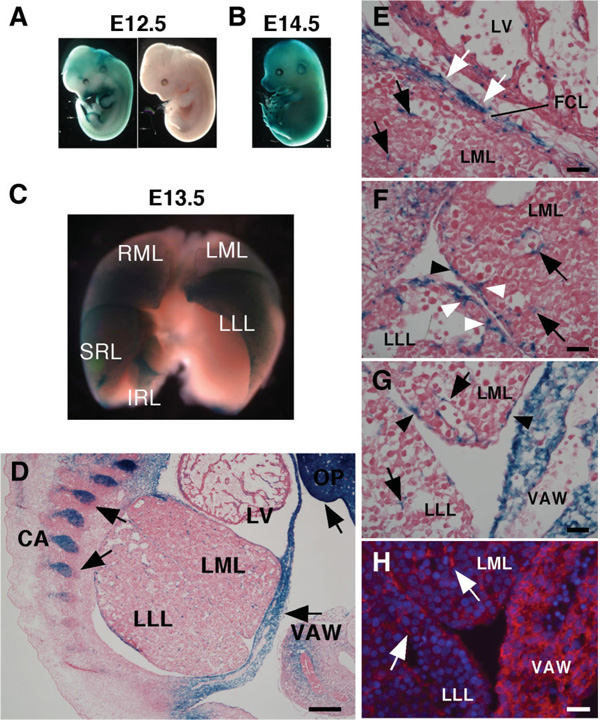
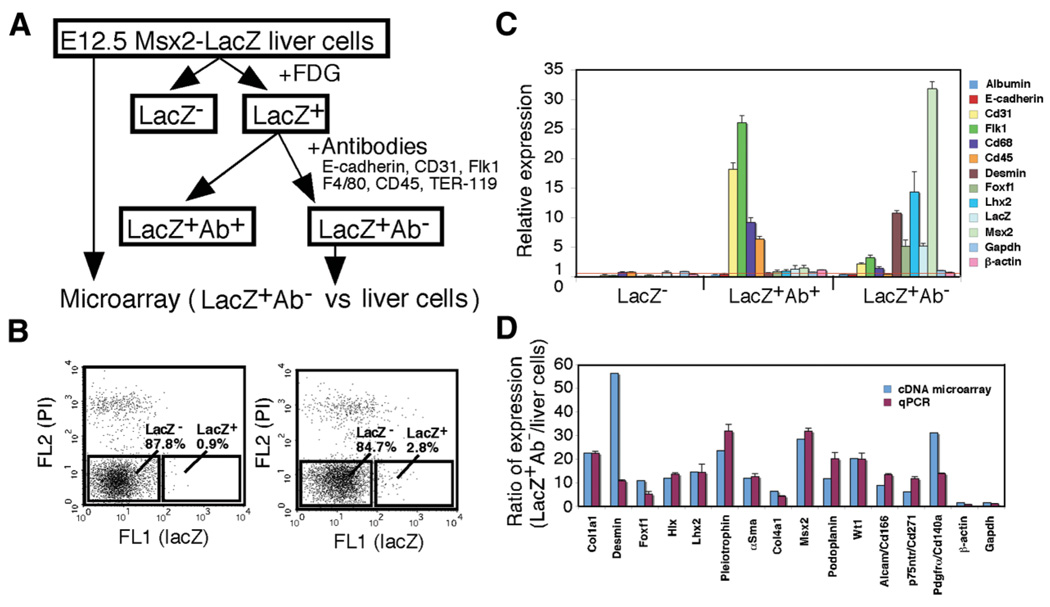
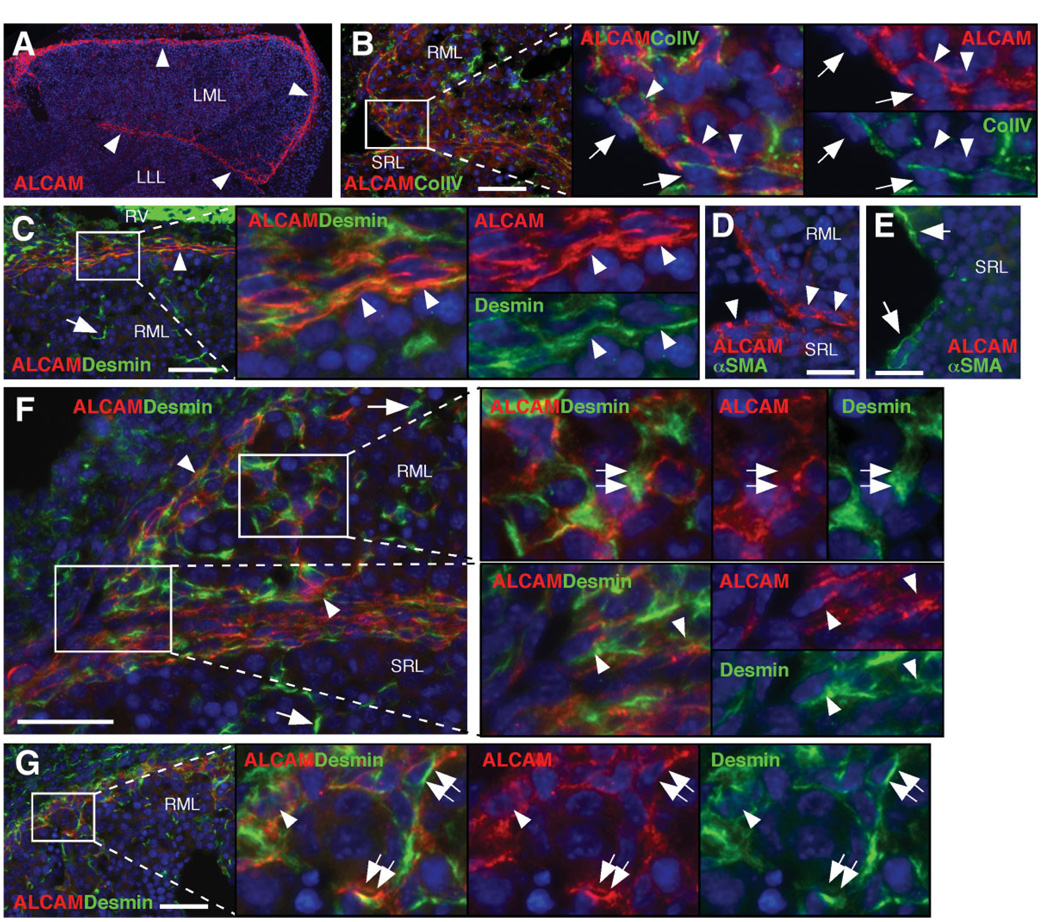
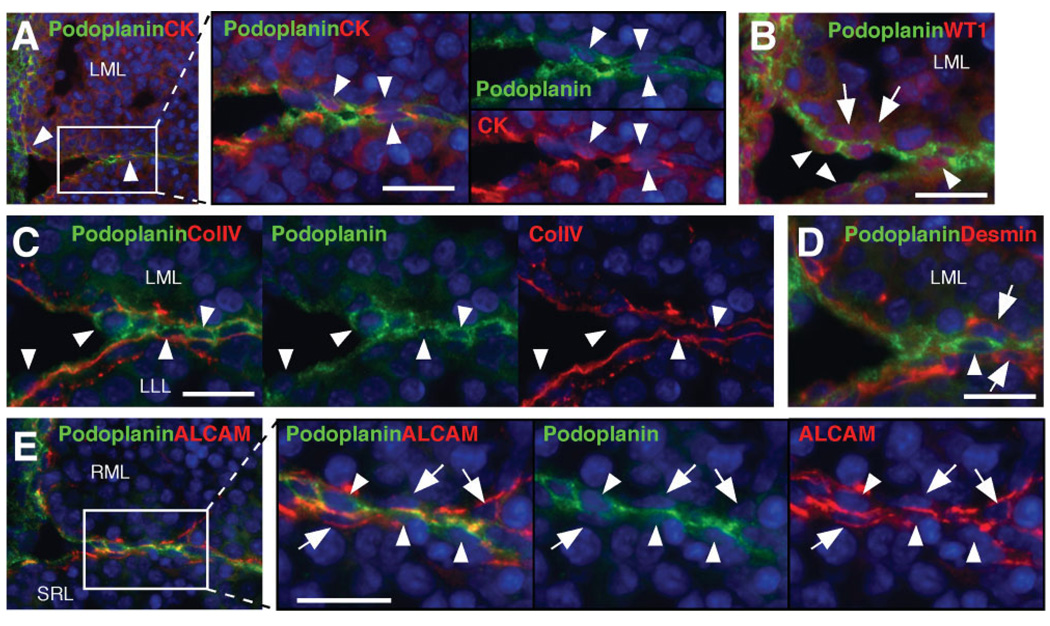
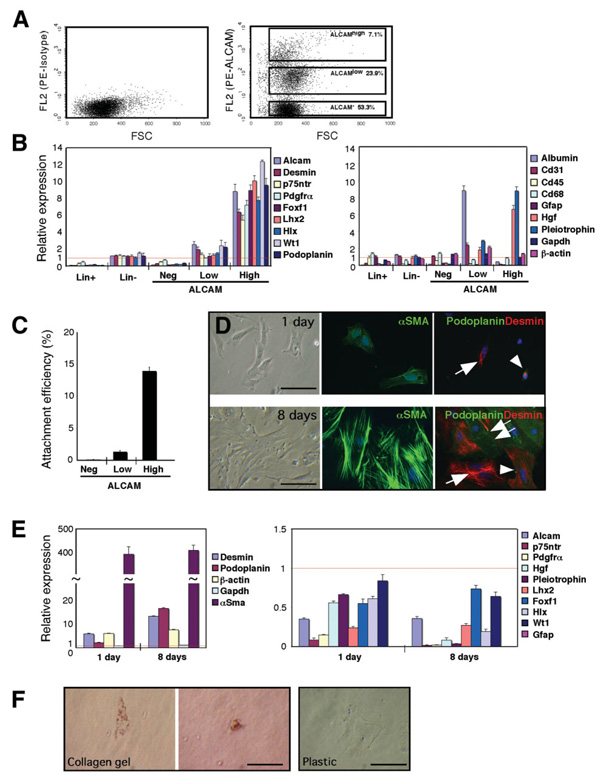
The knowledge concerning fetal hepatic stellate cells (HSCs) is scarce, and their cell lineage and functions are largely unknown. The current study isolated fetal liver mesenchymal cells from a mouse expressing beta-galactosidase under the control of Msx2 promoter by fluorescence-activated cell sorting (FACS) and surveyed marker genes by microarray analysis. Based on the location and immunostaining with conventional and newly disclosed markers, we have identified three distinct populations of fetal liver mesenchymal cells expressing both desmin and p75 neurotrophin receptor (p75NTR): HSCs in the liver parenchyma; perivascular mesenchymal cells expressing alpha-smooth muscle actin (alpha-SMA); and submesothelial cells associated with the basal lamina beneath mesothelial cells and expressing activated leukocyte cell adhesion molecule (ALCAM) and platelet-derived growth factor receptor alpha. A transitional cell type from the submesothelial cell phenotype to fetal HSCs was also identified near the liver surface. Mesothelial cells expressed podoplanin and ALCAM. Ki-67 staining showed that proliferative activity of the submesothelial cells is higher than that of mesothelial cells and transitional cells. Using anti-ALCAM antibodies, submesothelial and mesothelial cells were isolated by FACS. The ALCAM(+) cells expressed hepatocyte growth factor and pleiotrophin. In culture, the ALCAM(+) cells rapidly acquired myofibroblastic morphology and alpha-SMA expression. The ALCAM(+) cells formed intracellular lipid droplets when embedded in collagen gel and treated with retinol, suggesting the potential for ALCAM(+) cells to differentiate to HSCs. Finally, we demonstrated that fetal HSCs, submesothelial cells, and perivascular mesenchymal cells are all derived from mesoderm by using MesP1-Cre and ROSA26 reporter mice.

Conclusion: Fetal HSCs, submesothelial cells, and perivascular mesenchymal cells are mesodermal in origin, and ALCAM(+) submesothelial cells may be a precursor for HSCs in developing liver.


Conflict of interest statement

Potential conflict of interest: Nothing to report.

Figures

Fig. 1
Fig. 1
LacZ expression in Msx2 promoter driven-lacZ embryos. Whole mount X-gal staining in (A) E12.5 embryos, (B) E14.5 embryo, and (C) E13.5 liver. (A) LacZ expression in the limbs and head of the transgenic embryo (left), but not in the wild-type embryo (right). (B) Strong lacZ expression at the digits and olfactory placode. (C) An frontal view of liver X-gal staining. E13.5 liver is divided into the right and left median lobes (RML, LML), left lateral lobe (LLL), and superior and inferior right lobes (SRL, IRL). Intense X-gal staining is detected particularly at the ventral surface of the RML, SRL, and LLL. (D–H) Detection of lacZ expression on the E13.5 cryosections by X-gal staining (D–G) and immunohistochemistry of anti-β-galactosidase antibody (H). (D) Arrows indicate lacZ expression in the ventral abdominal wall (VAW), cartilage (CA), and olfactory placode (OP). LV; left ventricle. (E–G) Magnified views of cranial (E), dorsal (F), and ventral (G) regions of (D). Black arrows indicate lacZ expression in mesenchymal cells in the parenchyma and around the vein. LacZ expression is also found in the flat cell layers (FCL) covering the LML (white arrows), mesothelial cells (black arrowheads), and mesenchymal cells beneath the mesothelial cells (white arrowheads). (H) LacZ expression in the liver mesenchymal cells (white arrows) detected by β-galactosidase antibodies (red). Bar, 100 µm (D) and 10 µm (E–H).
Fig. 2
Fig. 2
LacZ expression in mesenchymal cells of the developing liver. Double immunostaining was performed on cryosections prepared from E12.5 Msx2-lacZ embryos. (A,B) Detection of desmin (green) and lacZ (red) at the liver surface. HSCs (arrows), perivascular mesenchymal cells (double arrows), and mesenchymal cells beneath the mesothelium (arrowheads) coexpress desmin and lacZ. (C) A merged image of (A) and (B). (D) Double staining of desmin (green) and lacZ (red) in the cranial region of the liver. Desmin and lacZ coexpression in HSCs (arrows) and the flat cell layers (arrowheads). PC, pericardial cavity. (E–J) Double staining of α-SMA (green) and desmin or lacZ (red). (E, F) Many of the α-SMA+ perivascular mesenchymal cells coexpress desmin (arrowheads). Double arrows indicate α-SMA cells in the desmin+ perivascular mesenchymal cells. Near the vessels, there are rare desmin+ α-SMA+ HSCs (arrows). Of 484 desmin+ HSCs, 3.7% are coexpressed with α-SMA. (G, H) α-SMA+ perivascular mesenchymal cells coexpress lacZ (arrowheads). Double arrows indicate α-SMA cells in the lacZ+ perivascular mesenchymal cells. (I, J) Alpha-SMAlacZ+ mesenchymal cells beneath the mesothelium (arrowheads). (K–O) Double staining of lacZ (red) and Flk1 (K, green), CD31 (L, green), F4/80 (M, green), E-cadherin (N, green), or albumin (O, green). No coexpression of lacZ (arrows) with these markers (arrowheads). (P) Negative control staining of isotype immunoglobulin G. Nuclei were counterstained with DAPI (blue). Bar, 25 µm.
Fig. 3
Fig. 3
Isolation of lacZ+ cells from E12.5 Msx2-lacZ livers and cDNA microarray analysis. (A) The procedure of lacZ+ liver mesenchymal cell isolation. After digestion of E12.5 livers, cells were incubated with FDG, and lacZ and lacZ+ cells were sorted by FACS. The lacZ+ cells were further incubated with antibodies against E-cadherin, CD31, Flk1, F4/80, CD45, and TER-119. Then, populations positive (lacZ+ Ab+) and negative (lacZ+ Ab) for those antibodies were obtained. The lacZ+ Ab population and liver cells were subjected to cDNA microarray analysis. (B) FACS analysis of E12.5 liver cells incubated with FDG prepared from lacZ (left) and lacZ+ embryonic livers (right). Dead cells were detected by propidium iodide (PI, FL2). In the lacZ+ liver cells, 2.8% of the cells show high FL1 caused by hydrolysis of FDG to fluorescein (right). (C) Quantitative PCR of the liver cells, lacZ, lacZ+Ab+, and lacZ+Ab populations separated from E12.5 livers. The results are expressed as relative expression compared with the liver cells (arbitrarily set at 1; red line). Glyceraldehyde 3-phosphate dehydrogenase (Gapdh) and β-actin were used as internal controls. (D) Comparison of gene expression levels obtained by cDNA microarray and those by qPCR from the lacZ+Ab and liver cells. Each value of qPCR is the mean ± standard deviation of triplicate measurements.
Fig. 4
Fig. 4
Identification of submesothelial cells in the developing livers. Immunostaining was performed on E12.5 Msx2-lacZ livers. (A) ALCAM immunostaining (red). ALCAM is expressed along the liver surface (arrowheads). (B) ALCAM (red) and collagen type IV (ColIV, green) staining in the dorsal region. Arrowheads indicate ALCAM+ submesothelial cells. Arrows indicate mesothelial cells. (C) ALCAM (red) and desmin (green) staining in the cranial region. Arrowheads indicate desmin+ ALCAM+ flat cells. An arrow indicates desmin+ ALCAM HSCs. RV, right ventricle. (D, E) ALCAM (red) and α-SMA (green) staining in the dorsal region (D) and around the blood vessel (E). Submesothelial cells express ALCAM (arrowheads), but not α-SMA. Perivascular mesenchymal cells express α-SMA (arrows), but not ALCAM. (F, G) ALCAM (red) and desmin (green) staining in the dorsal region. Arrows and arrowheads indicate desmin+ ALCAM HSCs and desmin+ ALCAM+ submesothelial cells, respectively. Double arrows indicate desmin+ ALCAM+ transitional cells away from the liver surface. Nuclei were counterstained with DAPI (blue). Bar, 20 µm.
Fig. 5
Fig. 5
Identification of mesothelial cells in the developing livers. Double immunostaining was performed on E12.5 Msx2-lacZ livers. (A–D) Detection of podoplanin (green) and pan-cytokeratin (CK, red), WT1 (red), collagen type IV (ColIV, red), or desmin (red) in the dorsal region. Arrowheads indicate podoplanin+ mesothelial cells. Arrows indicate submesothelial cells. (E) Podoplanin (green) and ALCAM (red) staining in the dorsal region. Arrowheads and arrows indicate podoplanin+ mesothelial cells and ALCAM+ submesothelial cells, respectively. Nuclei were counterstained with DAPI (blue). Bar, 10 µm.
Fig. 6
Fig. 6
Characterization of submesothelial cells. Double immunostaining was performed on E12.5 Msx2-lacZ livers. (A–C) Detection of p75NTR and desmin, ALCAM, or α-SMA. Arrows indicate p75NTR expression in desmin+ HSCs (A), ALCAM+ submesothelial cells (B), and α-SMA+ perivascular mesenchymal cells (C). Mesothelial cells are negative for p75NTR (arrowhead). (D) Expression of PDGFRα (green) and ALCAM (red) in the dorsal region. Arrows indicate PDGFRα+ ALCAM+ submesothelial cells. Nuclei were counterstained with DAPI (blue). (E) Summary of immunostaining in E12.5 livers. (F–I) Proliferative activities of submesothelial cells, mesothelial cells, and transitional cells in the E12.5 livers. (F) A representative merged image of Ki-67 (red) and ALCAM (green) staining. (G) Single DAPI image of (F). Mesothelial cells are identifiable at the liver surface (white circles). Of 534 mesothelial cells, 30.0% are Ki-67+ (I). (H) ALCAM and DAPI image of (F). Of 1,506 ALCAM+ submesothelial cells (red circles), 41.8% are Ki-67+ (I). Transitional cells are identified by ALCAM expression and irregular nuclei apart from the liver surface (white squares). Of 767 submesothelial cells, 22.8% are Ki-67+ (I). Bar, 10 µm (A–D), 20 µm (F).
Fig. 7
Fig. 7
Isolation and culture of ALCAM+ submesothelial and mesothelial cells. (A) After digestion of the E12.5 liver, blood cell lineage+ population (Lin+) was depleted. The lineage population (Lin) were incubated with phycoerythrin-labeled anti-ALCAM (right) or isotype control (left) and analyzed by FACS. The ALCAMhigh, ALCAMlow, and ALCAM populations were sorted. (B) Quantitative PCR of each population of E12.5 liver. The results are expressed as relative expression compared with the liver cells (arbitrarily set at 1; red lines). (C) Attachment efficiency of ALCAMhigh, ALCAMlow, and ALCAM populations. After FACS, these three populations were plated on 24-well plates (1 × 10⁴ cells/well). One day after culture, 20 photographs were randomly taken from four independent wells of each population, and the attached cell numbers were estimated. (D) Culture of the ALCAMhigh population at 1 and 8 days on plastic dish. The cells were stained with α-SMA (green) or desmin (red) and podoplanin (green). Arrowheads indicate cells coexpressing desmin and podoplanin. Arrows and double arrows indicate desmin+ and podoplanin+ cells, respectively. (E) Quantitative PCR of cultured ALCAMhigh population. The results are expressed as relative expression compared with the ALCAMhigh population before culture (arbitrarily set at 1; red lines). Increased expression was found in β-actin, but not Gapdh, at days 1 and 8. No Gfap expression was detected in both days 1 and 8 cultured cells. Each value of qPCR is the mean ± standard deviation of triplicate measurements. (F) Oil red O staining of day 5 ALCAMhigh cells in collagen gel or on plastic dish. Bar, 50 µm.
Fig. 8
Fig. 8
Mesoderm lineage analysis using MesP1-Cre and R26R mice. (A) A schema of the strategy for mesoderm lineage analysis using MesP1-Cre and R26R mice. Once MesP1 is expressed in the nascent mesoderm during gastrulation, the Cre recombinase excises the stop sequence between loxP sites (yellow triangles) in the R26R locus, and then, lacZ gene is constitutively expressed in the R26R locus of the cells derived from the nascent mesoderm. (B) X-gal staining of an E13.5 MesP1-Cre/R26R embryo. Blue staining is detected in the mesenchymal cells at the liver surface and in the liver parenchyma. (C–L) Double immunostaining of lacZ (red) and liver cell markers (green) including desmin (C–E), α-SMA (F), ALCAM (G), podoplanin (H), Flk1 (I), CD45 (J), albumin (K), and F4/80 (L). The left panels show merged images. The right two panels show magnified images of red and green fluorescence from the white rectangles in the left panel. (C–E) LacZ expression in desmin+ HSCs (C,D, arrows), submesothelial cells (D, arrowheads), and perivascular mesenchymal cells (E, arrows). Dotted lines demarcate the boundary between LLL and LML. (F) Arrows and arrowheads indicate LacZ+ α-SMA+ perivascular mesenchymal cells and LacZ+α-SMA endothelial cells, respectively. (G) LacZ+ ALCAM+ submesothelial cells between liver lobes (arrowheads). (H) LacZ+ podoplanin+ mesothelial cells (arrowheads) in the ventral region. Double arrows indicate lacZ podoplanin+ mesothelial cells. No lacZ expression in the podoplanin+ parietal mesothelial cells (arrows) in the ventral abdominal wall (VAW). (I) LacZ+Flk1+ endothelial cells in the blood vessel (arrowheads). An arrow indicates few Flk1+ SECs expressing lacZ weakly. (J) Arrows indicate rare lacZ+CD45+ cells. (K,L) No coexpression of lacZ and albumin or F4/80. Nuclei were counterstained with DAPI (blue). Bar, 50 µm (B) and 10 µm (C–L).

Comment in

References

    1. Friedman SL. Hepatic stellate cells: protean, multifunctional, and enigmatic cells of the liver. Physiol Rev. 2008;88:125–172. - PMC - PubMed
    1. Geerts A. History, heterogeneity, developmental biology, and functions of quiescent hepatic stellate cells. Semin Liver Dis. 2001;21:311–335. - PubMed
    1. Cassiman D, Barlow A, Vander Borght S, Libbrecht L, Pachnis V. Hepatic stellate cells do not derive from the neural crest. J Hepatol. 2006;44:1098–1104. - PubMed
    1. Hazra S, Xiong S, Wang J, Rippe RA, Krishna V, Chatterjee K, et al. Peroxisome proliferator-activated receptor γ induces a phenotypic switch from activated to quiescent hepatic stellate cells. J Biol Chem. 2004;279:11392–11401. - PubMed
    1. She H, Xiong S, Hazra S, Tsukamoto H. Adipogenic transcriptional regulation of hepatic stellate cells. J Biol Chem. 2005;280:4959–4967. - PubMed

Publication types

MeSH terms