. 2008 Dec:Chapter 5:Unit 5.7.
doi: 10.1002/0471250953.bi0507s24.

Using VMD: an introductory tutorial

Affiliations

Using VMD: an introductory tutorial

Jen Hsin et al. Curr Protoc Bioinformatics. 2008 Dec.

Abstract

VMD (Visual Molecular Dynamics) is a molecular visualization and analysis program designed for biological systems such as proteins, nucleic acids, lipid bilayer assemblies, etc. This unit will serve as an introductory VMD tutorial. We will present several step-by-step examples of some of VMD's most popular features, including visualizing molecules in three dimensions with different drawing and coloring methods, rendering publication-quality figures, animating and analyzing the trajectory of a molecular dynamics simulation, scripting in the text-based Tcl/Tk interface, and analyzing both sequence and structure data for proteins.


Figures

Figure 1
Figure 1
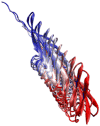
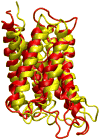
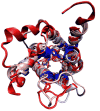
Example renderings made with VMD (Freddolino et al., 2006; Yin et al., 2006; Yu et al., 2006; Sotomayor et al., 2007; Wang et al., 2007).
Figure 2
Figure 2
Loading a molecule.
Figure 3
Figure 3
Rotational modes. (A) Rotation axes when holding down the left mouse key. (B) The rotation axes when holding down the right mouse key.
Figure 4
Figure 4
Mouse modes and their characteristic cursors.
Figure 5
Figure 5
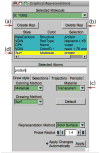
The Graphical Representations window.
Figure 6
Figure 6
(A) Licorice, (B) Tube, and (C) NewCartoon representations of ubiquitin.
Figure 7
Figure 7
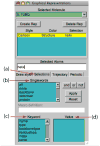
Graphical Representations window and the Selections tab.
Figure 8
Figure 8
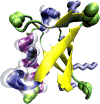
Multiple Representations of ubiquitin.
Figure 9
Figure 9
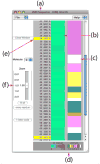
VMD Sequence window.
Figure 10
Figure 10
The effect of the resolution setting. (A) Low resolution: Sphere Resolution set to 8. (B) High resolution: Sphere Resolution set to 28.
Figure 11
Figure 11
Examples of different material settings. (A) The default transparent material, rendered in GLSL mode. (B) A user-defined material with high transparency, also rendered in GLSG mode.
Figure 12
Figure 12
Comparison of the (A) perspective and (B) orthographic projection modes.
Figure 13
Figure 13
Stereo image of the ubiquitin protein. Shown here with Cue Mode = Linear, Cue Start = 1.5, and Cue End = 2.75.
Figure 14
Figure 14
Example of a POV3 rendering.
Figure 15
Figure 15
Animation tools in the VMD main menu. The tools allow one to go over frames of the trajectory (e.g., using the “slider”) and to play a movie of the trajectory in various modes (Once, Loop, or Rock) and at an adjustable speed.
Figure 16
Figure 16
Image of every tenth frame shown at once, smoothed with a 20-frame window.
Figure 17
Figure 17
Water within 3A of the protein, shown for a selection that is not updated and for the one that is updated each frame. The snapshots shown are (from left to right) for frames 0, 17, and 99.
Figure 18
Figure 18
Ubiquitin in the VDW representation, colored according to the hydrophobicity of its residues.
Figure 19
Figure 19
The Molecule List Browser.
Figure 20
Figure 20
Result of the alignment between the two aquaporins using the measure fit command.
Figure 21
Figure 21
VMD Main menu after loading the four aquaporins.
Figure 22
Figure 22
The four aquaporins aligned according to their structural similarity.
Figure 23
Figure 23
Result of a structural alignment of the four aquaporins, colored by Qres.
Figure 24
Figure 24
Result of a sequence alignment of the four aquaporins, colored by sequence identity.
Figure 25
Figure 25
Top view of the aligned aquaporins colored by sequence conservation. The conserved residues locate mostly inside the aquaporin pore.
Figure 26
Figure 26
(A) A structure-based phylogenetic tree generated by QH values. (B) A sequence-based phylogenetic tree generated by ClustalW.
Figure 27
Figure 27
Labels in VMD.
Figure 28
Figure 28
RMSD Trajectory Tool. The RMSD is plotted for the equilibration of ubiquitin.
Figure 29
Figure 29
RMSD vs. time for the equilibration (blue) and pulling (red) trajectories of ubiquitin.
Figure 30
Figure 30
Distance between a residue and the center of ubiquitin. The distances analyzed are those for residue 76 (black) and residue 10 (green).

Similar articles

Cited by

References

    1. Eastwood MP, Hardin C, Luthey-Schulten Z, Wolynes PG. Evaluating the protein structure-prediction schemes using energy landscape theory. IBM J Res Dev. 2001;45:475–497.
    1. Freddolino PL, Arkhipov AS, Larson SB, McPherson A, Schulten K. Molecular dynamics simulations of the complete satellite tobacco mosaic virus. Structure. 2006;14:437–449. - PubMed
    1. Frishman D, Argos P. Knowledge-based secondary structure assignment. Proteins. 1995;23:566–579. - PubMed
    1. Humphrey W, Dalke A, Schulten K. VMD – Visual Molecular Dynamics. J Mol Graphics. 1996;14:33–38. - PubMed
    1. Isralewitz B, Gao M, Schulten K. Steered molecular dynamics and mechanical functions of proteins. Curr Opin Struct Biol. 2001;11:224–230. - PubMed

Publication types

LinkOut - more resources