. 2009 Mar;49(3):860-70.
doi: 10.1002/hep.22720.

Switch from Mnt-Max to Myc-Max induces p53 and cyclin D1 expression and apoptosis during cholestasis in mouse and human hepatocytes

Affiliations

Switch from Mnt-Max to Myc-Max induces p53 and cyclin D1 expression and apoptosis during cholestasis in mouse and human hepatocytes

Heping Yang et al. Hepatology. 2009 Mar.

Abstract

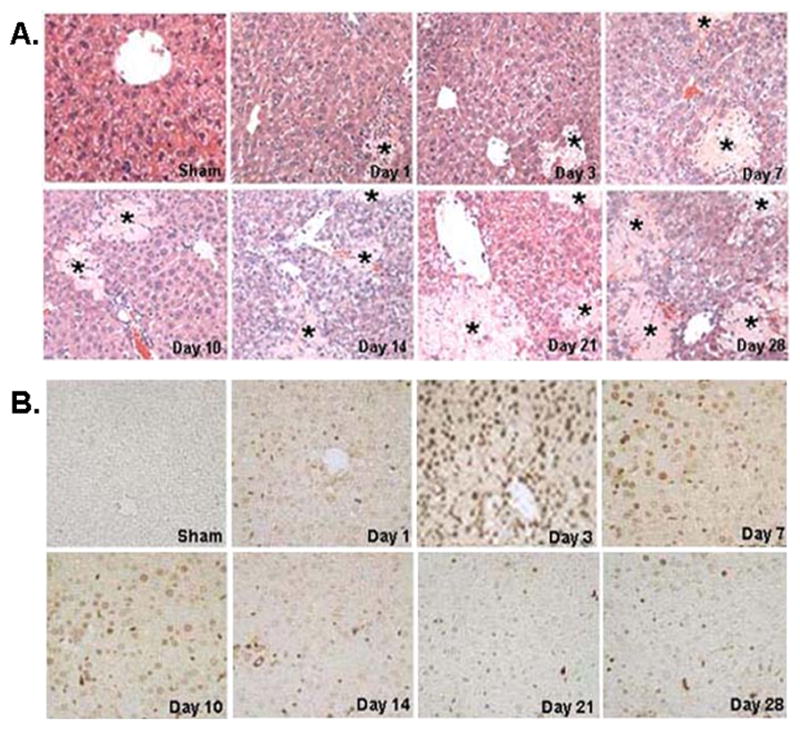
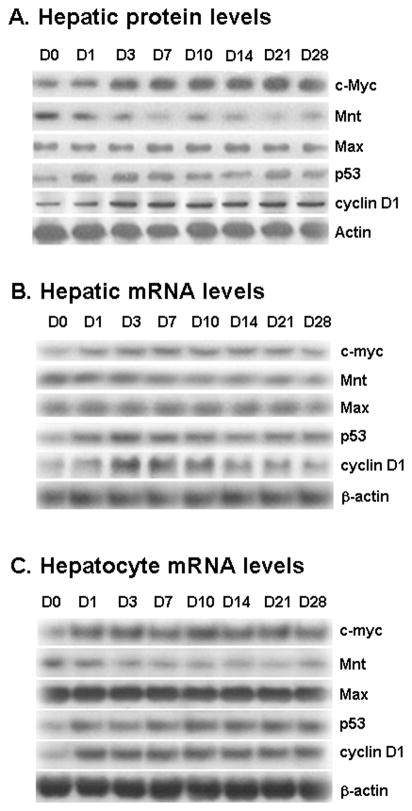
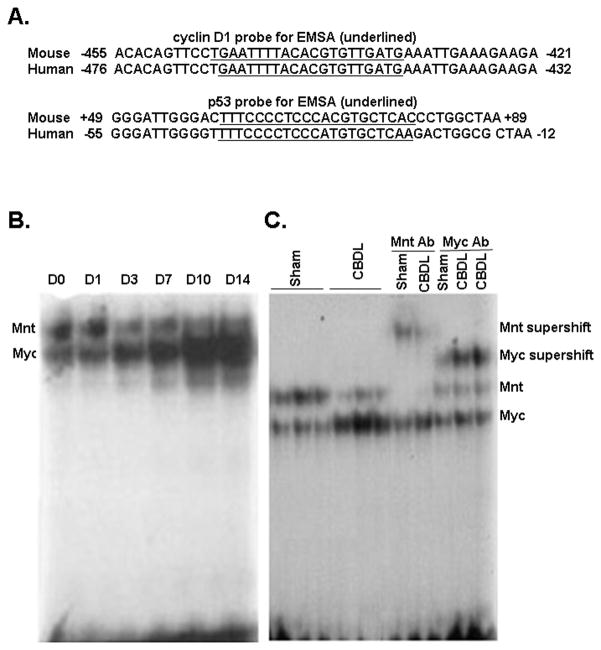
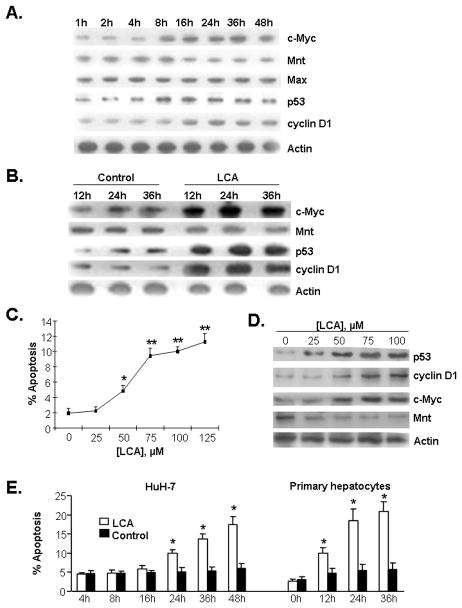
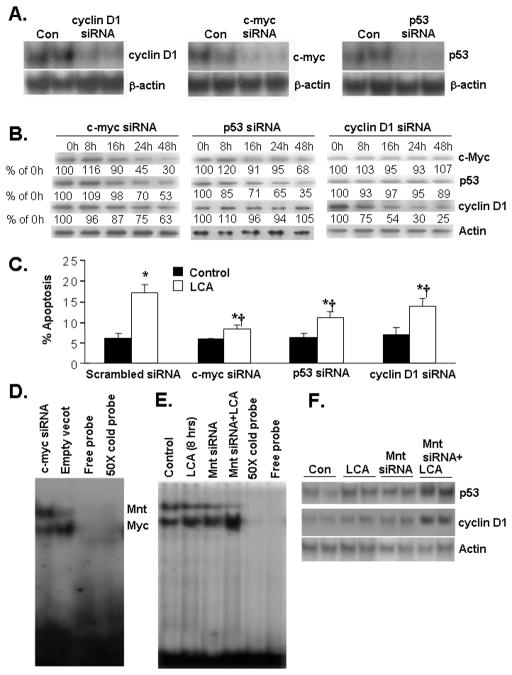
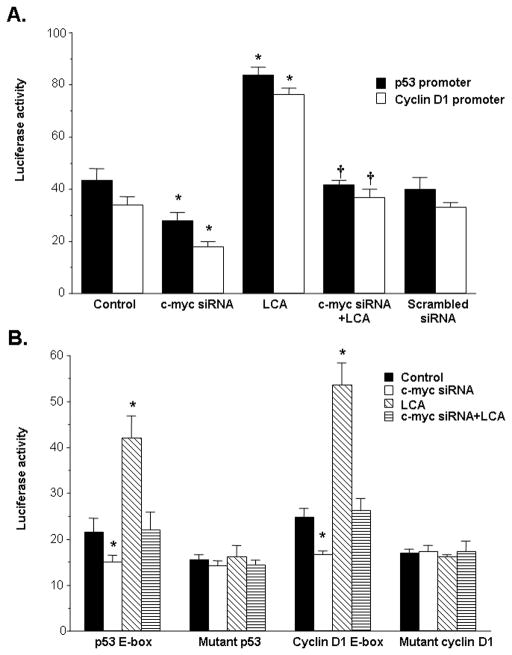
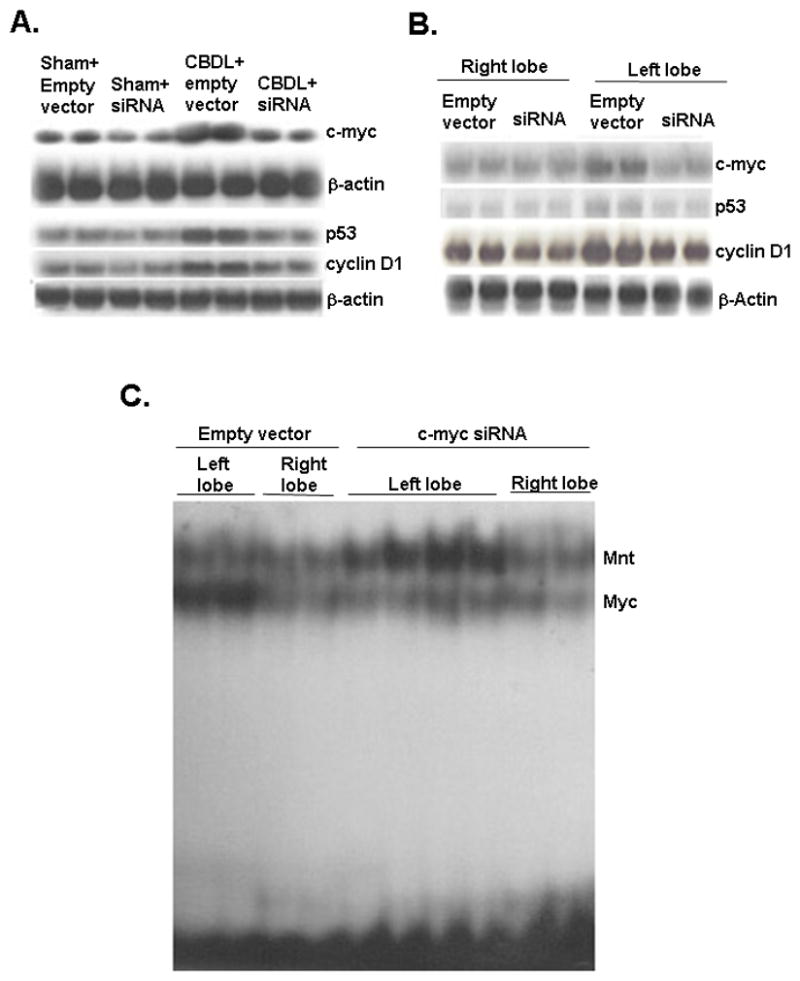
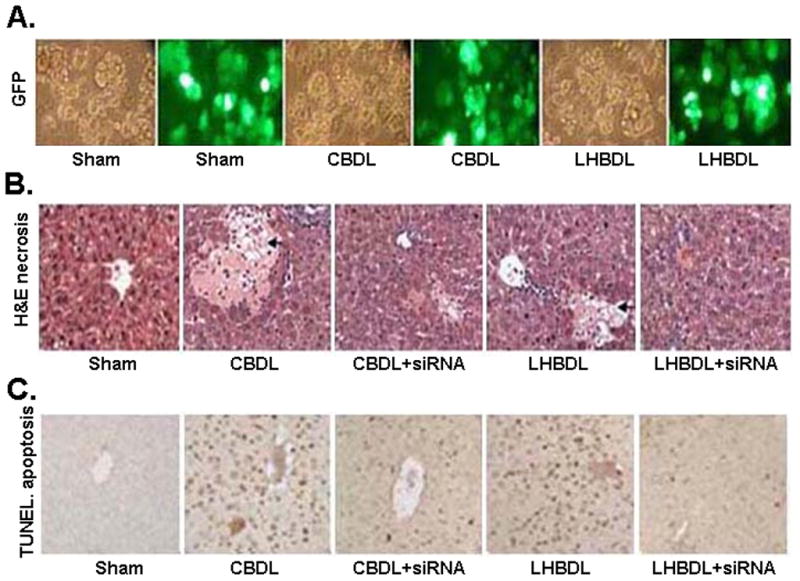
Toxic bile acids induce hepatocyte apoptosis, for which p53 and cyclin D1 have been implicated as underlying mediators. Both p53 and cyclin D1 are targets of c-Myc, which is also up-regulated in cholestasis. Myc and Mnt use Max as a cofactor for DNA binding. Myc-Max typically activates transcription via E-box binding. Mnt-Max also binds the E-box sequence but serves as a repressor and inhibits the enhancer activity of Myc-Max. The current work tested the hypothesis that the switch from Mnt-Max to Myc-Max is responsible for p53 and cyclin D1 up-regulation and apoptosis during cholestasis. Following common bile duct ligation or left hepatic bile duct ligation, the expression of p53, c-Myc, and cyclin D1 increased markedly, whereas Mnt expression decreased. Nuclear binding activity of Myc to the E-box element of p53 and cyclin D1 increased, whereas that of Mnt decreased in a time-dependent fashion. Lithocholic acid (LCA) treatment of primary human hepatocytes and HuH-7 cells induced a similar switch from Mnt to Myc and increased p53 and cyclin D1 promoter activity and endogenous p53 and cyclin D1 expression and apoptosis. Blocking c-Myc induction in HuH-7 cells prevented the LCA-mediated increase in p53 and cyclin D1 expression and reduced apoptosis. Lowering Mnt expression further enhanced LCA's inductive effect on p53 and cyclin D1. Bile duct-ligated mice treated with a lentivirus harboring c-myc small interfering RNA were protected from hepatic induction of p53 and cyclin D1, a switch from Mnt to Myc nuclear binding to E-box, and hepatocyte apoptosis.

Conclusion: The switch from Mnt to Myc during bile duct ligation and in hepatocytes treated with LCA is responsible for the induction in p53 and cyclin D1 expression and contributes to apoptosis.


Figures

Figure 1
Figure 1
A) Representative liver sections stained with H&E from CBDL and sham-operated mice, day 1 to day 28. The liver was histologically normal in Sham-operated mice. Liver tissues from day 1 on had increased necrosis in CBDL group. Stars indicate areas of hepatic necrosis (H&E staining, 200X). B) Representative liver sections stained with TUNEL from CBDL and sham-operated mice, day 1 to day 28. Cells negative for apoptosis exhibited no nuclear staining, whereas apoptotic cells exhibited brown nuclei staining. Hepatocyte apoptosis was not detected in sham-operated mice. Apoptotic cells were observed on day 1, peaked at day 3, maintained a persistent high level of apoptosis up to day 10, and decreased from day 14 to day 28 (TUNEL staining, 200X).
Figure 2
Figure 2
A) Effect of CBDL on protein levels of the c-Myc, Mnt, Max, p53, and cyclin D1 in liver tissues. Protein samples from liver tissues of CBDL mice from 0 to 28 days were analyzed by Western Blot analysis. To ensure equal loading, membranes were stripped and re-probed with anti-actin antibodies. Total protein (15 ug/lane) was loaded for protein expression analysis. Representative blots from at least 3 mice for each time point are shown and densitometric values are shown in supplemental figure 1A. B) Effects of CBDL on mRNA levels of c-myc, Mnt, Max, p53, and cyclin D1 in liver tissues. RNA was isolated from liver tissues of CBDL mice from day 0 to day 28 for Northern blot analysis (15 μg/lane). Membranes were stripped and re-probed with β-actin to ensure equal loading. Representative blots from at least 3 mice for each time point are shown and densitometric values are shown in supplemental figure 1B. C) Effects of CBDL on mRNA levels of c-myc, Mnt, Max, p53, and cyclin D1 in hepatocytes isolated from CBDL mice from day 0 to 28 post operation. Representative blots from at least 3 mice for each time point are shown and densitometric values are shown in supplemental figure 1C.
Figure 3
Figure 3
A) E-box sequences of mouse and human cyclin D1 and p53. The E-box sequence of mouse and human cyclin D1 is completely conserved and the E-box sequence of mouse p53 has only one mismatch as compared to the human p53. B) EMSA analysis using the mouse p53 E-box element showed the top band (Mnt) was decreased and the bottom band (c-Myc) was increased from day 0 to day 14 after CBDL. C) Supershift analysis using the mouse p53 E-box element identified bound proteins to include c-Myc and Mnt. The c-Myc antibody generated a strong supershift band derived from lower band; while the Mnt antibody supershifted the top band. Similar results were obtained using the mouse cyclin D1 E-box element (not shown).
Figure 4
Figure 4
A) Western blot analysis of c-Myc, Mnt, Max, p53, and cyclin D1 in LCA (100 μM) treated HuH-7 cells from 1 to 48 hours. To ensure equal loading, membranes were stripped and re-probed with anti-actin antibodies. Total protein (15 μg/lane) was used for assay. Representative blots from at least 3 independent experiments for each time point are shown and densitometric values are shown in supplemental figure 2A. B) Effects of LCA on protein levels of c-Myc, Mnt, p53 and cyclin D1 in primary human hepatocytes treated for varying time points. Total protein (15 μg/lane) was subjected to Western Blot analysis. Membranes were stripped and re-probed with actin for housekeeping control. Representative blots from at least 3 independent experiments for each time point are shown and densitometric values are shown in supplemental figure 2B. C) Dose-response of LCA on apoptosis in HuH-7 cells. HuH-7 cells were treated with LCA (0 to 125 μM) for 24 hours and apoptosis was assessed as described in Methods. Results represent mean±SEM from 3 experiments. *p<0.05, **p<0.005 vs. 0. D) Dose-response of LCA on p53, cyclin D1, c-Myc, and Mnt protein levels in HuH-7 cells. HuH-7 cells were treated with LCA (0 to 100 μM) for 24 hours and protein levels were determined by Western blot analysis as described above. E) Effect of LCA on HuH-7 and primary human hepatocyte apoptosis. After LCA treatment (100 μM), apoptosis increased from 24 hours to 48 hours in HuH-7 and from 12 hours to 36 hours in primary hepatocytes. Results represent mean±SEM from 3 independent experiments. *p<0.05 vs. respective controls for the different time points.
Figure 5
Figure 5
A) Efficiency of c-myc, p53 and cyclin D1 knockdown in HuH-7 cells. Cells were treated with siRNA for 36 hours and mRNA levels were determined by Northern blot analysis. Scrambled siRNA had no effect (not shown). B) Effect of siRNA against c-myc, p53, and cyclin D1 on protein levels of c-Myc, p53 and cyclin D1 in LCA-treated HuH-7 cells. HuH-7 cells were transfected with siRNA for these genes for 0, 8, 16, 24 or 48 hours and then treated with LCA for 8 hours for evaluation of c-Myc, p53 and cyclin D1 knockdown efficiency. Numbers below each blot refer to densitometric values as % of 0 h (LCA treatment alone). C) Effect of c-myc, p53 and cyclin D1 siRNA on LCA- mediated HuH-7 apoptosis. HuH-7 cells were transfected with siRNA for 24 hours followed by LCA treatment for another 24 hours. *p<0.05 vs. respective controls, †p<0.05 vs. LCA+scrambled siRNA. D) Effect of c-myc siRNA on Mnt and Myc nuclear binding activity to E box of p53 promoter in HuH-7 cells. HuH-7 cells were treated with c-myc siRNA for 48 hours and EMSA for p53 promoter E-box binding was performed as described in Methods. For specificity, 50X cold probe was added. E) Effect of Mnt knockdown on baseline and LCA-mediated nuclear binding to E-box. HuH-7 cells were treated with Mnt siRNA for 48 hours followed by LCA (100 μM) for another 8 hours. EMSA for p53 promoter E-box binding activity was performed as above. F) Effect of Mnt knockdown on baseline and LCA-mediated induction of p53 and cyclin D1 protein levels. HuH-7 cells were treated with Mnt siRNA for 48 hours followed by LCA (100 μM) for another 8 hours and Western blot analysis was performed as described in Methods.
Figure 6
Figure 6
Effects of LCA and c-myc siRNA on promoter activity of p53 and cyclin D1. A) HuH-7 cells were treated with c-myc siRNA or scrambled siRNA for 24 hours, then transfected with either the p53 or cyclin D1 promoter for another 10 hours. LCA (100 μM) was added during the last 8 hours of the p53 or cyclin D1 promoter transfection. Results represent mean±SEM from 3 independent experiments done in triplicates. *p<0.05 vs. control or scrambled siRNA. †p<0.05 vs. LCA. B) The protocol used was the same as in A) except the promoter constructs consisted of only the E-box elements of these promoters in native or mutated sequences as described in Methods. Results represent mean±SEM from 3 independent experiments done in triplicates. *p<0.05 vs. respective control.
Figure 7
Figure 7
A) Northern blot analysis of c-myc, p53 and cyclin D1 in livers of CBDL and sham-operated mice treated with lentivirus harboring c-myc siRNA or empty vector injection. See supplemental figure 3A for densitometric analysis. B) Northern blot analysis of c-myc, p53 and cyclin D1 in left lobes and right lobes from LHBDL mice treated with lentivirus harboring c-myc siRNA or empty vector injection. See supplemental figure 3B for densitometric analysis. C) Effect of c-myc siRNA on Myc and Mnt nuclear binding activity in LHBDL mice. Mice were treated with c-myc siRNA or empty vector followed by LHBDL as described in Methods. EMSA for E-box binding of p53 was performed using nuclear protein extracts from the left and right lobes 3 days later.
Figure 8
Figure 8
A) Transduction efficiency of the lentivirus infection. Hepatocytes were isolated on day 3 from mice treated with CBDL, LHBDL (left lobe) or sham operation. Transduction efficiency was measured by positive GFP expression in hepatocytes. The corresponding phase image shows more than 80% of the hepatocytes were infected in sham operated and bile duct ligated groups. B) H&E staining shows c-myc siRNA infection reduced hepatic necrosis in CBDL and LHBDL mice on day 3. The entire liver in sham-operated controls and right lobe in LHBDL group by c-myc siRNA infection did not exhibit any necrosis. Arrowheads indicate hepatic necrosis (H&E staining, 200X). C) TUNEL staining (200X) shows that c-myc siRNA infection also inhibited hepatocyte apoptosis in CBDL and LHBDL mice on day 3. The entire liver in sham-operated controls of CBDL and the right lobe of LHBDL mice did not exhibit any apoptosis.

References

    1. Trauner M, Meier PJ, Boyer JL. Molecular pathogenesis of cholestasis. N Engl J Med. 1998;339:1217–1227. - PubMed
    1. Guicciardi ME, Gores GJ. Bile acid-mediated hepatocyte apoptosis and cholestatic liver disease. Dig Liver Dis. 2002;34:387–392. - PubMed
    1. Murre C, Bain G, van Dijk MA, Engel I, Furnari BA, Massari ME, Matthews JR, et al. Structure and function of helix-loop-helix proteins. Biochim Biophys Acta. 1994;1218:129–135. - PubMed
    1. Nieminen AI, Partanen JI, Klefstrom J. c-Myc blazing a trail of death: coupling of the mitochondrial and death receptor apoptosis pathways by c-Myc. Cell Cycle. 2007;6:2464–2472. - PubMed
    1. Nilsson JA, Cleveland JL. Myc pathways provoking cell suicide and cancer. Oncogene. 2003;22:9007–9021. - PubMed

Publication types

MeSH terms