. 2008 Dec 16:8:222.
doi: 10.1186/1471-2180-8-222.

Environmental rRNA inventories miss over half of protistan diversity

Affiliations

Environmental rRNA inventories miss over half of protistan diversity

Sunok Jeon et al. BMC Microbiol. .

Abstract

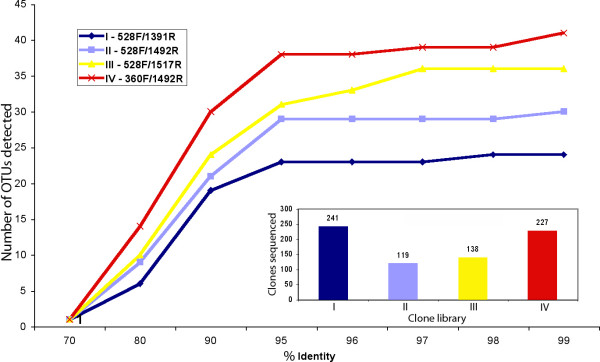
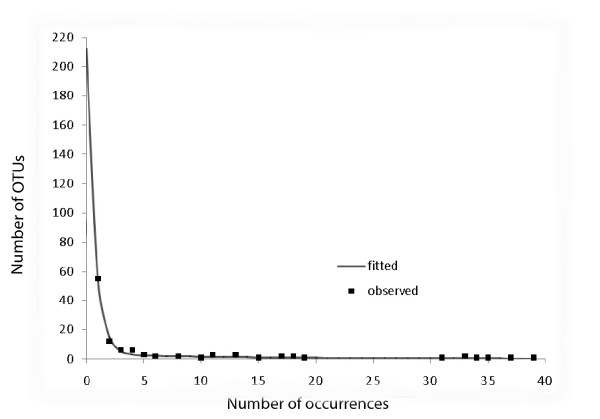
Background: The main tool to discover novel microbial eukaryotes is the rRNA approach. This approach has important biases, including PCR discrimination against certain rRNA gene species, which makes molecular inventories skewed relative to the source communities. The degree of this bias has not been quantified, and it remains unclear whether species missed from clone libraries could be recovered by increasing sequencing efforts, or whether they cannot be detected in principle. Here we attempt to discriminate between these possibilities by statistically analysing four protistan inventories obtained using different general eukaryotic PCR primers.

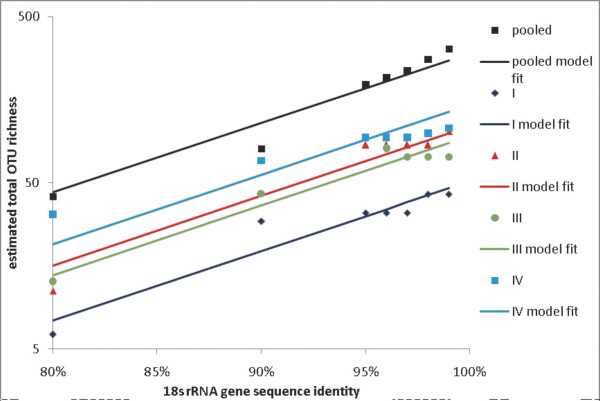
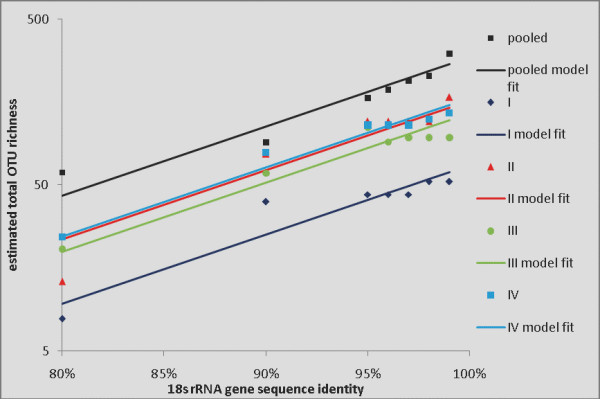
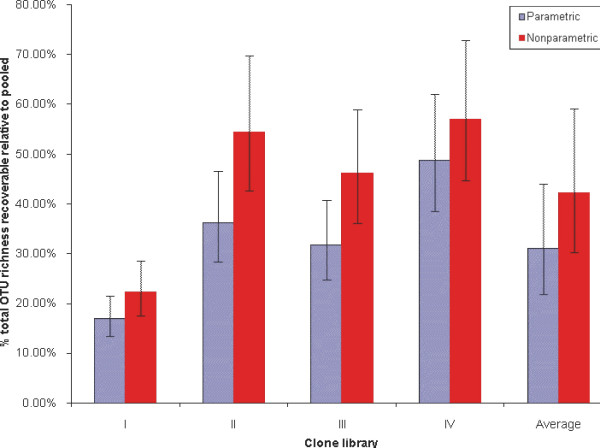
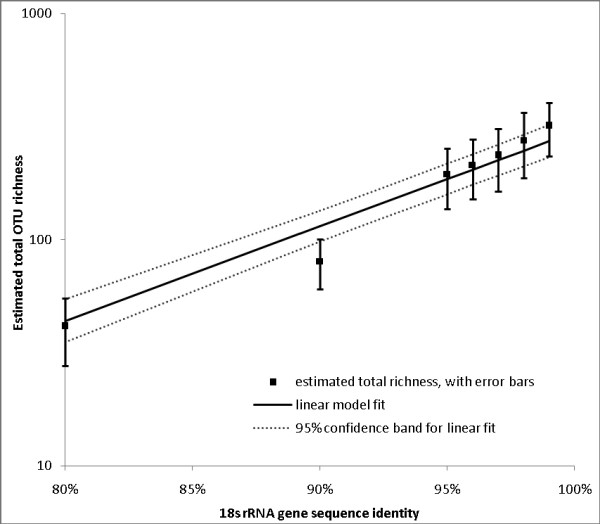
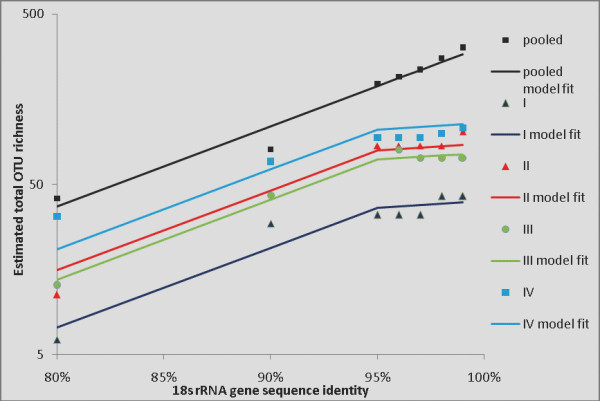
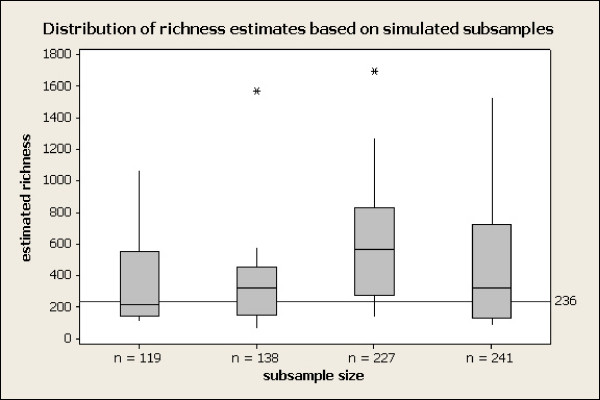
Results: We show that each PCR primer set-specific clone library is not a sample from the community diversity but rather from a fraction of this diversity. Therefore, even sequencing such clone libraries to saturation would only recover that fraction, which, according to the parametric models, varies between 17 +/- 4% to 49 +/- 10%, depending on the set of primers. The pooled data is thus qualitatively richer than individual libraries, even if normalized to the same sequencing effort.

Conclusion: The use of a single pair of primers leads to significant underestimation of the true community richness at all levels of taxonomic hierarchy. The majority of available protistan rRNA gene surveys likely sampled less than half of the target diversity, and might have completely missed the rest. The use of multiple PCR primers reduces this bias but does not necessarily eliminate it.


Figures

Figure 1
Figure 1
Observed numbers of OTUs in clone libraries obtained using four different PCR primer sets, as a function of % 18S rRNA gene sequence identity.
Figure 2
Figure 2
Total OTU richness as a function of % sequence identity (parametric estimates). Estimated total OTU richness (points), and fitted parallel linear regressions (lines) for datasets I, II, III, IV and pooled, as a function of % sequence identity, based on parametric total richness estimates.
Figure 3
Figure 3
Total OTU richness as a function of % sequence identity (nonparametric estimates). Estimated total OTU richness (points), and fitted parallel linear regressions (lines) for datasets I, II, III, IV and pooled, as a function of % sequence identity, based on nonparametric total richness estimates.
Figure 4
Figure 4
Estimated total richness recoverable using primer sets I, II, III, and IV, and their average, expressed as % of richness recoverable by pooling data from all four primer sets, with 95% confidence intervals, according to parametric and nonparametric models.
Figure 5
Figure 5
Parametric model fitted to frequency-count data. Fit of mixture-of-two-exponentials OTU abundance model (curve) to observed frequency-count data (points), with projection to zero frequency (unobserved OTUs), for pooled data at 99% sequence similarity level (data point at (133,1) omitted for clarity).
Figure 6
Figure 6
Total OTU richness based on pooled sample (parametric estimates). Estimated total OTU richness as a function of % similarity level, showing original estimates with +/- 1.96 standard error bars, and fitted linear model with +/- 1.96 standard error (95% confidence) band.
Figure 7
Figure 7
Total OTU richness as a function of % sequence identity (parametric estimates), changepoint model. Estimated total OTU richness (points), and fitted regression functions for datasets I, II, III, IV (changepoint model) and pooled (linear model), as a function of % sequence identity, based on parametric richness estimates.
Figure 8
Figure 8
Distribution of richness estimates based on simulated subsamples. Distribution of 10 simulated replicate richness estimates, at each of 4 (sub)sample sizes, 97% similarity level, compared to "true" (postulated for this simulation) richness = 236 OTUs. Lower end of box = 1st quartile; central line in box = median; upper end = third quartile.

References

    1. Olsen GJ, Lane DJ, Giovannoni SJ, Pace NR, Stahl DA. Microbial ecology and evolution: a ribosomal RNA approach. Annu Rev Microbiol. 1986;40:337–365. doi: 10.1146/annurev.mi.40.100186.002005. - DOI - PubMed
    1. Diez B, Pedros-Alio C, Massana R. Study of genetic diversity of eukaryotic picoplankton in different oceanic regions by small-subunit rRNA gene cloning and sequencing. Appl Environ Microbiol. 2001;67:2932–2941. doi: 10.1128/AEM.67.7.2932-2941.2001. - DOI - PMC - PubMed
    1. Lopez-Garcia P, Rodriguez-Valera F, Pedros-Alio C, Moreira D. Unexpected diversity of small eukaryotes in deep-sea Antarctic plankton. Nature. 2001;409:603–607. doi: 10.1038/35054537. - DOI - PubMed
    1. Moon-van der Staay SY, De Wachter R, Vaulot D. Oceanic 18S rDNA sequences from picoplankton reveal unsuspected eukaryotic diversity. Nature. 2001;409:607–610. doi: 10.1038/35054541. - DOI - PubMed
    1. Rusch DB, Halpern AL, Sutton G, Heidelberg KB, Williamson S, Yooseph S, Wu D, Eisen JA, Hoffman JM, Remington K, et al. The Sorcerer II Global Ocean Sampling expedition: northwest Atlantic through eastern tropical Pacific. PLoS Biol. 2007;5:e77. doi: 10.1371/journal.pbio.0050077. - DOI - PMC - PubMed

Publication types

LinkOut - more resources