. 2008 Dec 16:9:542.
doi: 10.1186/1471-2105-9-542.

Corra: Computational framework and tools for LC-MS discovery and targeted mass spectrometry-based proteomics

Affiliations

Corra: Computational framework and tools for LC-MS discovery and targeted mass spectrometry-based proteomics

Mi-Youn Brusniak et al. BMC Bioinformatics. .

Abstract

Background: Quantitative proteomics holds great promise for identifying proteins that are differentially abundant between populations representing different physiological or disease states. A range of computational tools is now available for both isotopically labeled and label-free liquid chromatography mass spectrometry (LC-MS) based quantitative proteomics. However, they are generally not comparable to each other in terms of functionality, user interfaces, information input/output, and do not readily facilitate appropriate statistical data analysis. These limitations, along with the array of choices, present a daunting prospect for biologists, and other researchers not trained in bioinformatics, who wish to use LC-MS-based quantitative proteomics.

Results: We have developed Corra, a computational framework and tools for discovery-based LC-MS proteomics. Corra extends and adapts existing algorithms used for LC-MS-based proteomics, and statistical algorithms, originally developed for microarray data analyses, appropriate for LC-MS data analysis. Corra also adapts software engineering technologies (e.g. Google Web Toolkit, distributed processing) so that computationally intense data processing and statistical analyses can run on a remote server, while the user controls and manages the process from their own computer via a simple web interface. Corra also allows the user to output significantly differentially abundant LC-MS-detected peptide features in a form compatible with subsequent sequence identification via tandem mass spectrometry (MS/MS). We present two case studies to illustrate the application of Corra to commonly performed LC-MS-based biological workflows: a pilot biomarker discovery study of glycoproteins isolated from human plasma samples relevant to type 2 diabetes, and a study in yeast to identify in vivo targets of the protein kinase Ark1 via phosphopeptide profiling.

Conclusion: The Corra computational framework leverages computational innovation to enable biologists or other researchers to process, analyze and visualize LC-MS data with what would otherwise be a complex and not user-friendly suite of tools. Corra enables appropriate statistical analyses, with controlled false-discovery rates, ultimately to inform subsequent targeted identification of differentially abundant peptides by MS/MS. For the user not trained in bioinformatics, Corra represents a complete, customizable, free and open source computational platform enabling LC-MS-based proteomic workflows, and as such, addresses an unmet need in the LC-MS proteomics field.


Figures

Figure 1
Figure 1
Top elements of APML. In the presented XML schema graph notation, dotted rectangles represent optional elements and solid rectangles represent required elements. Complex types, which can be used as common element types, are defined by shaded boxes. Elements with "+" indicate there are further subelements and elements with "-" indicate that it has been expanded to display in the figure. formula image indicates sequence type of child elements and formula image indicates choice type of child elements. A) The apml element has two child elements. The dataProcessing element stores software information, and data element child elements of either feature list as peak_list element, or alignment feature list as alignment element. The cluster_profile element is an optional element for a list of clustered feature references in any time course or dilution series experiment. The dataProcessing element stores software information, and data element stores either feature list as peak_list element or alignment feature list as alignment element. B) The peak_lists can have one to many peak_list elements, which stores the detected features of a single LC-MS run. C) The alignment element stores all LC-MS file information in feature_source_list, and aligned features are stored in aligned_features element.
Figure 2
Figure 2
Additional elements of APML. XML schema graph notation is the same as described in Figure 1 above. A) Both FeatureType in peak_list and AlignedFeatureType in alignment elements have CoordinateType, which contains coordinates for each feature, defined by required attributes of m/z, rt (retention time), charge and mass. It also has optional retention time, m/z and scan range child elements. B) We also defined the optional PpidCollectionType element for each feature, to store putative feature identification, via MS/MS tandem mass spectrometry experiments and/or other existing database references. C) ClusterProfile Type element is to store grouped features, by referencing the features defined in either peak_list or alignment, since some post-alignment processing tools might need to cluster LC-MS processed features by some criteria. For example, features whose intensities display a correlation with a sample concentration dilution series can be grouped and stored in this optional element.
Figure 3
Figure 3
APML parser documentation. Corra software provides an APML parser package written in java. This is to facilitate Corra customization via the adaptation of existing software or analytical components, or importing of new software or analytical components, as required by users with specific workflow needs. This figure shows an example screenshot of the parser package documentation.
Figure 4
Figure 4
APML viewer. Corra also provides a 2D graphical APML viewer, for user-friendly visualization of peak list or aligned APML files. A) It allows for color-coding of displayed features according to observed charge state, or the number of LC-MS runs the feature was successfully aligned for. Feature coordinates can be zoomed in and out to allow viewing of entire APML files, or just regions of particular interest. B) When a given aligned feature is selected, a pop-up window will be displayed for that feature across all LC-MS runs in the dataset.
Figure 5
Figure 5
Corra graphical user interface (GUI). Example screenshots of the Corra GUI, provided as a web client using Google Web Toolkit. The GUI guides users, step by step, through the Corra pipeline, and also to serves to organize data by project, in a user-friendly way, not requiring extensive knowledge of computational biology. A) Project setup GUI panel guides project organization and status. B) Analysis GUI panel displays figures from analyses.
Figure 6
Figure 6
Summary of the Corra framework data flow. In the flow chart, the rectangular boxes represent one or more software processing steps, parallelograms represent data, and the cylinder represents databases. The application of Corra begins with the input of data in mzXML format, converted from the raw files from any of various mass spectrometers capable of producing sufficient resolution to resolve isotopic distribution. Features (defined by m/z, retention time, and intensity) for each input LC-MS run are extracted, based on observed isotopic distribution, and with the resultant peak list stored in APML format. Extracted features are then aligned across all LC-MS runs for the dataset in question, with the resultant aligned features list also and stored in the aligned APML format. The xml format of the aligned APML is then parsed into standard R data format, ExpressionSet, prior to statistical analyses. Statistical tests, using linear mixed model, are performed on all the aligned features, together with any relevant biological and technical replicate information in the sample set. The current implementation of Corra has adapted the previously published LC-MS quantification software tools SpecArray [12] and SuperHirn [15] for feature extraction and alignment.
Figure 7
Figure 7
Corra-generated hierarchical clustering of human type 2 diabetes plasma analyses. N-glycosite peptides were isolated from human plasma samples and analyzed via LC-MS, as described under Methods. Randomized, triplicate analyses were performed for each of 22 human plasma samples, 13 controls (NGT: normal glucose tolerance) and 9 from newly diagnosed cases of type 2 diabetes (DB). The hierarchical cluster shown is for the 558 multi-charged features that aligned across all 66 LC-MS runs. Randomly assigned patient numbers are included to show how the replicate MS analyses of the same samples clustered together as the most similar, as expected. One of the misclassified DB patient samples was annotated as from a 'likely not fasted' subject, as required by the OGTT assay used to diagnose diabetes, according to documentation provided with the samples.
Figure 8
Figure 8
Corra-generated volcano plot of human type 2 diabetes plasma analyses. N-glycosite peptides were isolated for human plasma samples and analyzed via LC-MS, as described under Methods. Randomized, triplicate analyses were performed for each of 22 human plasma samples, 13 controls (NGT: normal glucose tolerance) and 9 from newly diagnosed cases of type 2 diabetes (DB). Volcano plot displays the 4,240 features that aligned across a minimum of 3 LC-MS runs. The x-axis shows observed log fold change in aligned feature mean intensities between the two sample groups, NGT and DB. The y-axis shows B statistics log Odds for non-random differential abundance obtained for each aligned feature. Red colored dots represent the 400 top-ranked features (in terms of log Odds) that were subsequently targeted for MS/MS identification. A log Odds value of 0 corresponds to a 50% probability non-random differential abundance, and a log Odds of 2.2 to a 90% probability.
Figure 9
Figure 9
Corra-generated hierarchical clustering of yeast phosphopeptide analyses. Phosphopeptides were isolated from two yeast strains, one wild type, and the other an Ark1 protein kinase knockout, and analyzed in triplicate on a very high mass accuracy LC-MS platform, as described under Methods. The 22,562 Corra-detected features that aligned across 3 or more LC-MS runs were used to produce this hierarchical cluster that well distinguished between the two samples, as expected.
Figure 10
Figure 10
Corra generated volcano plot of yeast phosphopeptide analyses. Phosphopeptides were isolated from two yeast strains, one wild type, and the other an Ark1 protein kinase knockout, and analyzed in triplicate on a very high mass accuracy LC-MS platform, as described under Methods. Volcano plot displays 22,562 features that aligned across 3 or more LC-MS runs. The x-axis shows observed log fold change in aligned feature mean intensities between the two yeast strains. The y-axis shows B-statistics log Odds for non-random differential abundance obtained for each aligned feature. Red colored dots indicate features with a log Odds value of ≥ 2.2 (which translates to a posterior probability of 90% chance of non-random differential abundance) and that also utilized the 'n/a replace' capability in Corra (for missing values). Blue colored dots indicate features with a log Odds value of ≥ 2.2, but did not require use of the 'n/a replace' function. A log Odds value of 0 corresponds to a 50% probability of non-random differential abundance, and a log Odds of 2.2 to a 90% probability.
Figure 11
Figure 11
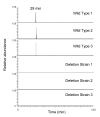
Verification of a Corra-identified Ark1 kinase substrate peptide/protein. Following targeted MS/MS identification of the top-ranked Corra-identified discriminatory features (see Figure 10 and Table 2) ion chromatograms were extracted from all LC-MS runs for the peptide RHS*LGLNEAKK (m/z = 444.895 [M+3H]3+), where S* represents phosphoserine. This peptide was derived from the protein YDR293C, and was confirmed as present in all 3 control sample analyses, but absent in all 3 Ark1 knockout analyses, as would be expected. For all six plots, a relative abundance of 100% was manually set to 107 ion counts so that all were on the same scale.

References

    1. Aebersold R, Mann M. Mass spectrometry-based proteomics. Nature. 2003;422:198–207. doi: 10.1038/nature01511. - DOI - PubMed
    1. Gillette MA, Mani DR, Carr SA. Place of pattern in proteomic biomarker discovery. J Proteome Res. 2005;4:1143–1154. doi: 10.1021/pr0500962. - DOI - PubMed
    1. MacCoss MJ, Matthews DE. Quantitative MS for proteomics: teaching a new dog old tricks. Anal Chem. 2005;77:294A–302A. doi: 10.1021/ac053431e. - DOI - PubMed
    1. Mueller LN, Brusniak MY, Mani DR, Aebersold R. An assessment of software solutions for the analysis of mass spectrometry based quantitative proteomics data. J Proteome Res. 2008;7:51–61. doi: 10.1021/pr700758r. - DOI - PubMed
    1. Gygi SP, Rist B, Gerber SA, Turecek F, Gelb MH, Aebersold R. Quantitative analysis of complex protein mixtures using isotope-coded affinity tags. Nat Biotechnol. 1999;17:994–999. doi: 10.1038/13690. - DOI - PubMed

Publication types

LinkOut - more resources