. 2009 Mar;181(3):997-1011.
doi: 10.1534/genetics.108.099309. Epub 2008 Dec 15.

Statistical mechanics and the evolution of polygenic quantitative traits

Affiliations

Statistical mechanics and the evolution of polygenic quantitative traits

N H Barton et al. Genetics. 2009 Mar.

Abstract

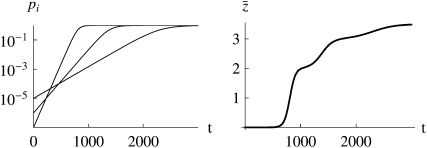
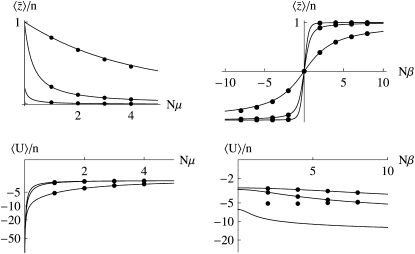
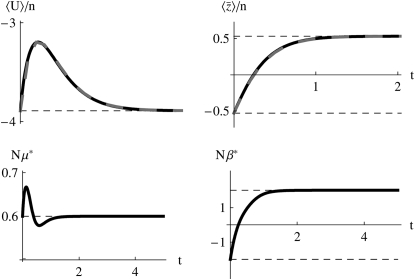
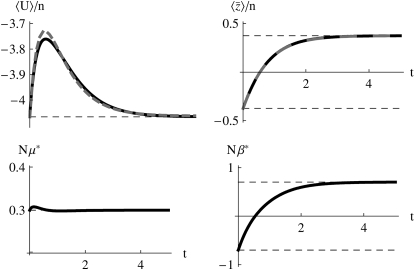
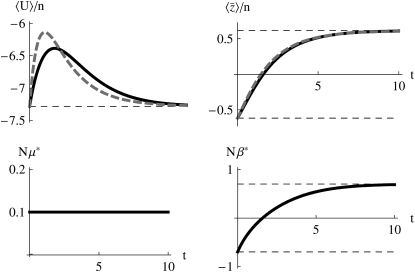
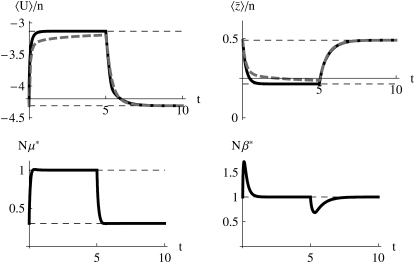
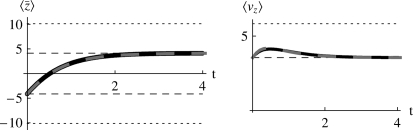
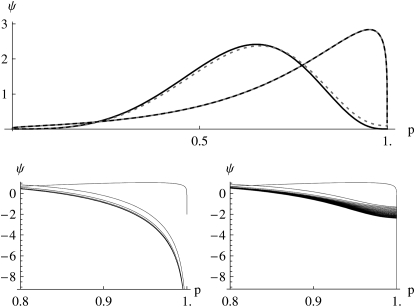
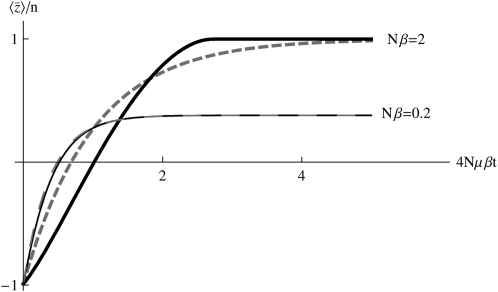
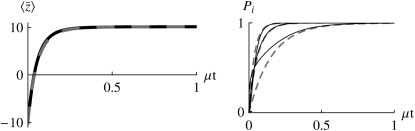
The evolution of quantitative characters depends on the frequencies of the alleles involved, yet these frequencies cannot usually be measured. Previous groups have proposed an approximation to the dynamics of quantitative traits, based on an analogy with statistical mechanics. We present a modified version of that approach, which makes the analogy more precise and applies quite generally to describe the evolution of allele frequencies. We calculate explicitly how the macroscopic quantities (i.e., quantities that depend on the quantitative trait) depend on evolutionary forces, in a way that is independent of the microscopic details. We first show that the stationary distribution of allele frequencies under drift, selection, and mutation maximizes a certain measure of entropy, subject to constraints on the expectation of observable quantities. We then approximate the dynamical changes in these expectations, assuming that the distribution of allele frequencies always maximizes entropy, conditional on the expected values. When applied to directional selection on an additive trait, this gives a very good approximation to the evolution of the trait mean and the genetic variance, when the number of mutations per generation is sufficiently high (4Nmicro > 1). We show how the method can be modified for small mutation rates (4Nmicro --> 0). We outline how this method describes epistatic interactions as, for example, with stabilizing selection.


Figures

F<sc>igure</sc> 1.—
Figure 1.—
The frequency of favorable alleles at three loci (left) and the mean of an additive trait, formula image (right). Initial frequencies are 10−5, 10−6, 10−7, and effects on the trait are 1, 2, formula image, so that formula image; the selection gradient is β = 0.01 (i.e., fitness is formula image).
F<sc>igure</sc> 2.—
Figure 2.—
Dependence of formula image on Nμ, Nβ. The solid curves show the diffusion approximation, while the dots show exact values for the Wright–Fisher model with N = 100. The plots against Nμ (left column) show Nβ = 0.1, 1, 10; those against Nβ (right column) show Nμ = 0.1, 1, 10. Agreement between discrete and continuous models is close for formula image and for 4Nμ > 1, but the diffusion approximation fails to predict formula image when 4Nμ = 0.1 (bottom series of dots at bottom right). (For the discrete model, formula image is calculated omitting fixed classes.)
F<sc>igure</sc> 3.—
Figure 3.—
(Top) Calculation of genetic variability formula image (left) and trait mean formula image (right) and over time, with Nμ = 0.6 as Nβ changes from −2 to +2 at time t = 0. The horizontal lines show the stationary values. The solid curves show the approximation, and the dashed curves show numerical solutions to the diffusion equation; these are not distinguishable on this scale. (Bottom) Changes over time in the parameters μ* (left) and β* (right), calculated using the approximation of Equation 16. Time is scaled to 2N generations.
F<sc>igure</sc> 4.—
Figure 4.—
The accuracy of the approximation for Nμ = 0.3. Nβ changes from −0.7 to +0.7 at time t = 0. Otherwise, details are as in Figure 3.
F<sc>igure</sc> 5.—
Figure 5.—
The accuracy of the approximation for Nμ = 0.1. Nβ changes from −0.7 to +0.7 at time t = 0. The effective mutation rate, Nμ*, is held fixed at Nμ (bottom left). Otherwise, details are as in Figure 3.
F<sc>igure</sc> 6.—
Figure 6.—
The mutation rate increases abruptly from Nμ = 0.3 to Nμ = 1 at t = 0 and then changes back at t = 5; throughout, Nβ = 1. The horizontal dashed lines show values at the stationary states, the dashed curves show numerical solutions of the diffusion equation, and the solid curves in the top row show the approximation.
F<sc>igure</sc> 7.—
Figure 7.—
The accuracy of the approximation with unequal allelic effects, γ, given by Equation 25. Nβ changes from −2 to +2 at time t = 0; Nμ = 0.5 throughout. Otherwise, details are as in Figure 3.
F<sc>igure</sc> 8.—
Figure 8.—
Failure of the maximum entropic distribution of allele frequencies at the borders for changing mutation rates. Top panel, dotted curves: the genuine distribution, given by the diffusion equation; solid curves show the maximum entropic distribution. The bulk of the distributions is well approximated initially (curves toward the right; t = 0) and close to equilibrium (bell-shaped curves; t = 5). Bottom left panel: the max-entropic distribution at different times (from t = 0 to t = 5, top to bottom) near the edge p = 1 incorrectly predicts that there is no fixation, compared the diffusion equation solutions at different times (from t = 0 to t = 5, top to bottom) near the edge p = 1, which shows that some genotype fixes (bottom right panel). Numerics are as in Figure 6.
F<sc>igure</sc> 9.—
Figure 9.—
Comparison between the exact solution (Equation 27) and the maximum entropy approximation (Equation 28), in the limit of low mutation rates (4Nμ → 0). Initially, the probability that a locus is fixed for the “1” allele is P = 0.02 at all loci, so that formula image; all alleles have effect γ = 1. Selection Nβ = 0.2 or Nβ = 2 is then applied, and the trait mean shifts to a new equilibrium, in which a fraction P = 1/(1 + exp(−4Nβ)) of loci are fixed for the 1 allele. When selection is weak (Nβ = 0.2), the maximum entropy approximation is barely distinguishable from the exact solution. However, when selection is strong (Nβ = 2), the maximum entropy approximation (dashed lines) underestimates the initial rate of change.
F<sc>igure</sc> 10.—
Figure 10.—
The maximum entropy approximation (Equation 29), made assuming that populations jump between fixed states, gives an accurate prediction for the change in mean (left): this is indistinguishable from the exact solution (Equation 27). The population is initially at equilibrium with directional selection Nβ = −4; selection then changes sign abruptly. Allelic effects are given by Equation 25. Predictions for the underlying allele frequencies are less accurate. (Right) Allele frequencies at the locus with the strongest effect formula image, with intermediate effect formula image, and with the weakest effect formula image, reading left to right. Solid lines show the maximum entropy approximation (Equation 29), and dashed lines show the exact solution (Equation 27).

References

    1. Ao, P., 2008. Emerging of stochastic dynamical equalities and steady state thermodynamics from Darwinian dynamics. Commun. Theor. Phys. 49 1073–1090. - PMC - PubMed
    1. Barton, N. H., 1986. The maintenance of polygenic variation through a balance between mutation and stabilizing selection. Genet. Res. 49 157–174. - PubMed
    1. Barton, N. H., 1989. The divergence of a polygenic system under stabilizing selection, mutation and drift. Genet. Res. 54 59–77. - PubMed
    1. Barton, N. H., and P. D. Keightley, 2002. Understanding quantitative genetic variation. Nat. Rev. Genet. 3 11–21. - PubMed
    1. Barton, N. H., and M. Turelli, 1987. Adaptive landscapes, genetic distance, and the evolution of quantitative characters. Genet. Res. 49 157–174. - PubMed

Publication types