

PSI-BLAST pseudocounts and the minimum description length principle
- PMID: 19088134
- PMCID: PMC2647318
- DOI: 10.1093/nar/gkn981
PSI-BLAST pseudocounts and the minimum description length principle
Abstract
Position specific score matrices (PSSMs) are derived from multiple sequence alignments to aid in the recognition of distant protein sequence relationships. The PSI-BLAST protein database search program derives the column scores of its PSSMs with the aid of pseudocounts, added to the observed amino acid counts in a multiple alignment column. In the absence of theory, the number of pseudocounts used has been a completely empirical parameter. This article argues that the minimum description length principle can motivate the choice of this parameter. Specifically, for realistic alignments, the principle supports the practice of using a number of pseudocounts essentially independent of alignment size. However, it also implies that more highly conserved columns should use fewer pseudocounts, increasing the inter-column contrast of the implied PSSMs. A new method for calculating pseudocounts that significantly improves PSI-BLAST's; retrieval accuracy is now employed by default.
Figures
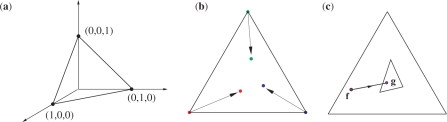
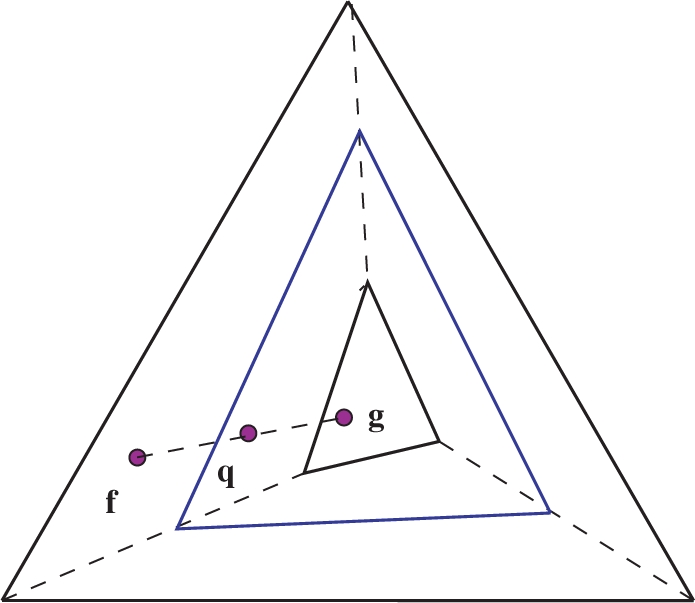
 that maps f to a point q on the line between f and g, and the frequency distribution space to the intermediate simplex shown.
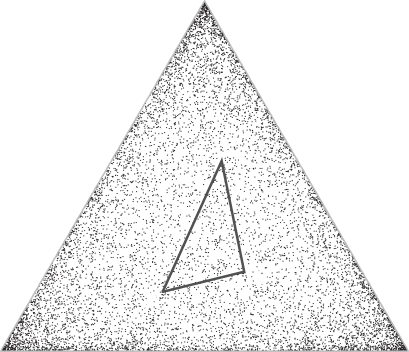
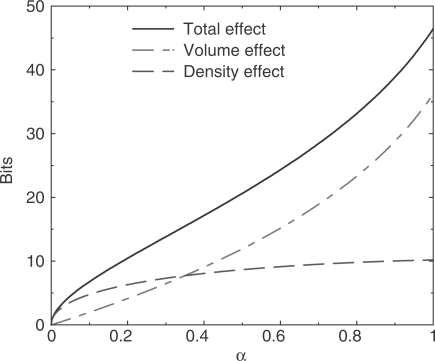
 . The total decrease can be decomposed into a decrease in simplex volume, and a decrease in independent theory density. Half as many independent theories corresponds to a decrease of one bit. Positive values on the y-axis represent decreases in model description length.
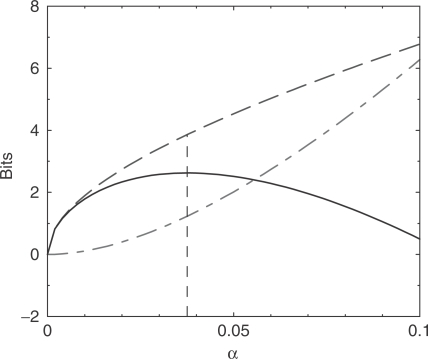
 , for α between 0 and 0.1. The dot-dashed curve (in red) shows the increase in the description length of the data. The dashed curve (in blue) shows the decrease in the description length of the model. The total decrease in the description length, shown by the solid curve (in black), is maximized at
  , which corresponds to 19.4 pseudocounts.
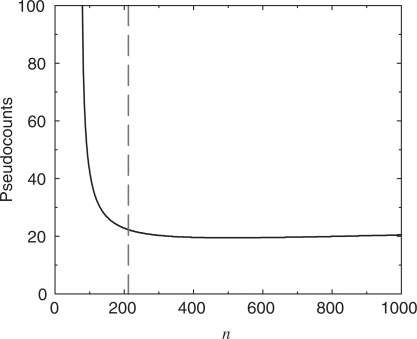
 is greater than the description length of the model at
  , but it is not possible for a model to have a negative description length. For n between 212 and 1000, the calculation suggests we use a nearly constant number m of pseudocounts, roughly 19.4. In the limit of very large n, the MDL principle suggests the number of pseudocounts should grow proportionately to n1/3.
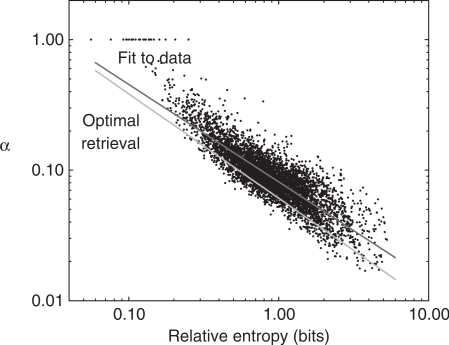
 independent observations are considered. The x-axis represents the relative entropy D(f′ || p), where f′ is the observed frequency vector of the column after the addition of m0 = 5.5 pseudocounts, and p is the background amino acid frequency vector implicit in BLOSUM-62. The y-axis represents the pseudocount proportion α calculated from the MDL theory. The upper diagonal line (shown in red) represents the best power-law fit to the data. The lower diagonal line (shown in green) represents the power-law relationship of α to D(f′ || p) that empirically yields the optimal retrieval on the training set. Note that the background frequency vector p is the fixed point of the linear transformation M. Therefore, if f′= p, the increase in the description length of the data is identically zero for all α, implying that the MDL is optimized at
  . For any finite n, vectors f′ close enough to p also imply an optimal α of 1. A small number of such points are seen at the upper left of this graph.
References
-
- Smith TF, Waterman MS. Identification of common molecular subsequences. J. Mol. Biol. 1981;147:195–197. - PubMed
-
- Dayhoff MO, Schwartz RM, Orcutt BC. A model of evolutionary change in proteins. In: Dayhoff MO, editor. Atlas of Protein Sequence and Structure. Vol. 5. Washington, DC: National Biomedical Research Foundation; 1978. pp. 345–352.
-
- Schwartz RM, Dayhoff MO. Matrices for detecting distant relationships. In: Dayhoff MO, editor. Atlas of Protein Sequence and Structure. Vol. 5. Washington, DC: National Biomedical Research Foundation; 1978. pp. 353–358.
Publication types
MeSH terms
Grants and funding
LinkOut - more resources
Full Text Sources
Research Materials
