. 2008 Dec 23;105(51):20179-84.
doi: 10.1073/pnas.0807121105. Epub 2008 Dec 16.

Determination of tag density required for digital transcriptome analysis: application to an androgen-sensitive prostate cancer model

Affiliations

Determination of tag density required for digital transcriptome analysis: application to an androgen-sensitive prostate cancer model

Hairi Li et al. Proc Natl Acad Sci U S A. .

Abstract

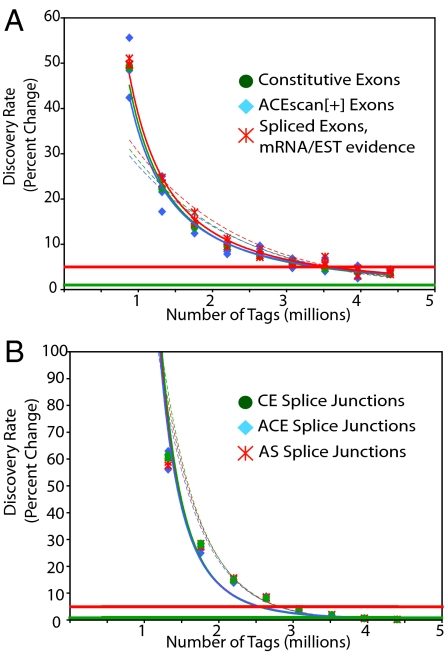
High-throughput sequencing has rapidly gained popularity for transcriptome analysis in mammalian cells because of its ability to generate digital and quantitative information on annotated genes and to detect transcripts and mRNA isoforms. Here, we described a double-random priming method for deep sequencing to profile double poly(A)-selected RNA from LNCaP cells before and after androgen stimulation. From approximately 20 million sequence tags, we uncovered 71% of annotated genes and identified hormone-regulated gene expression events that are highly correlated with quantitative real time PCR measurement. A fraction of the sequence tags were mapped to constitutive and alternative splicing events to detect known and new mRNA isoforms expressed in the cell. Finally, curve fitting was used to estimate the number of tags necessary to reach a "saturating" discovery rate among individual applications. This study provides a general guide for analysis of gene expression and alternative splicing by deep sequencing.


Conflict of interest statement

The authors declare no conflict of interest.

Figures

Fig. 1.
Fig. 1.
The double random priming method for deep sequencing. The first biotinylated random primer consists of the sequencing primer P1 at the 5′ end and a random octamer at the 3′ end. Products of the first random priming reaction were selected on streptavidin beads (blue eclipse) followed by the second random priming reaction on the solid phase with a random octamer carrying the sequencing primer P2. After extensive washes to remove free primers and primer dimmers, the second random priming products were released from beads by heat, which were then PCR-amplified, gel-purified, and subjected to sequencing from the P1 primer.
Fig. 2.
Fig. 2.
Global mapping of sequence tags. (A) Summary of genomic mapping results, allowing 2 mismatches in 35 nt. For comparison, additional mapping results that include tags that hit up to 5 positions in the genome or with tags after removal of the first 4 nt and last 3 nt are shown in Table S1. Sequence tags mapped to splice junctions include known junctions and junctions determined in this study. (B) Transcription from top (+) and bottom (−) strands of human chromosome X. The data showed high reproducibility with high (>0.7) Pearson correlation coefficients within the same strands and low (<0.04) correlation between different strands (see Table S2). (C) Genomic distribution of sequence tags in exons, introns, promoters (3 kb from transcription start sites), and intergenic regions. (D) Sense and antisense transcripts. Sequence tags corresponding to both sense and antisense transcripts were color-coded and displayed on a composite mRNA map with the x axis showing the tag position (% of spliced mRNA region) and the y axis showing the tag density (tags per megabase).
Fig. 3.
Fig. 3.
Digital analysis of androgen-regulated gene expression in LNCaP cells. (A) Scatter plot of gene expression in mock-treated and DHT-induced cells. Differential expressed genes were labeled red based on χ2 (P < 0.01). (B) Comparison of fold changes determined by sequencing and by quantitative measurement with real time PCR. (C) Comparison with 5 published microarray datasets in LNCaP cells. The currently determined androgen-regulated genes showed 25% overlap with at least one published microarray study as indicated by color-coded sections in the pie-chart. Specifically, 218 genes showed no overlap; 87 overlapped with 1 report; 30 with 2; 10 with 3; 9 with 4, and only 1 gene was common with all 5 published reports. Detailed comparisons of individual genes identified in the current and published studies were summarized in Table S6. (D) Curve fitting the change in the number of new features detected relative to increasing tag densities. Dashed line indicated exponential curve fit; solid line indicated power curve fit. R2 coefficients for each fitted curve were displayed in Table 1. The graph indicated that as the tag density increased the rate of identification of additional transcripts (blue) and DHT-induced transcripts (orange) decreased. The horizontal lines indicated where the discovery rate drops below 5% (red) and 1% (green).
Fig. 4.
Fig. 4.
Curve fitting the change in the number of exons and splice junctions detected against increasing tag densities. Dashed line indicated exponential curve; solid line indicated power curve. R2 coefficients for each fitted curves were displayed in Table 1. (A) Decline in the rate of identifying additional exons as a function of increasing tag density. (B) Decline in the rate of identifying additional splice junctions as a function of increasing tag density. The horizontal lines in both panels indicate where discovery rate drops below 5% (red) and 1% (green).

Similar articles

Cited by

References

    1. Cheng J, et al. Transcriptional maps of 10 human chromosomes at 5-nucleotide resolution. Science. 2005;308:1149–1154. - PubMed
    1. Birney E, et al. Identification and analysis of functional elements in 1% of the human genome by the ENCODE pilot project. Nature. 2007;447:799–816. - PMC - PubMed
    1. Kapranov P, et al. Large-scale transcriptional activity in chromosomes 21 and 22. Science. 2002;296:916–919. - PubMed
    1. Kapranov P, Willingham AT, Gingeras TR. Genome-wide transcription and the implications for genomic organization. Nat Rev Genet. 2007;8:413–423. - PubMed
    1. Mortazavi A, Williams BA, McCue K, Schaeffer L, Wold B. Mapping and quantifying mammalian transcriptomes by RNA-Seq. Nat Methods. 2008;5:621–628. - PubMed

Publication types