. 2009 Mar;19(3):460-9.
doi: 10.1101/gr.087619.108. Epub 2008 Dec 16.

Genome-wide profiling of salt fractions maps physical properties of chromatin

Affiliations

Genome-wide profiling of salt fractions maps physical properties of chromatin

Steven Henikoff et al. Genome Res. 2009 Mar.

Abstract

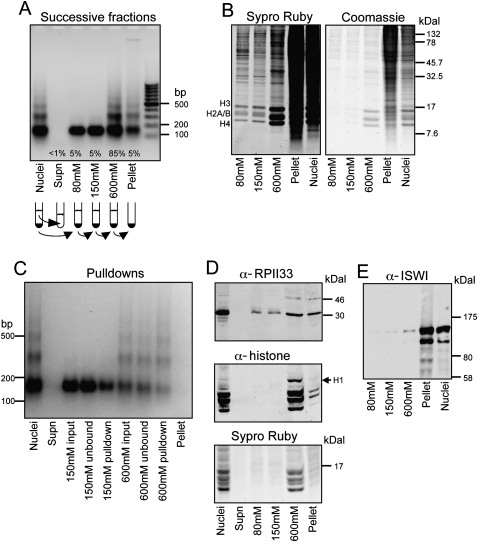
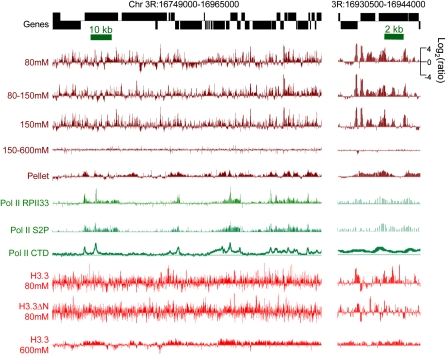
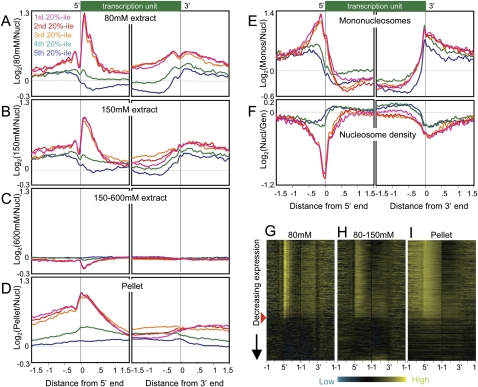
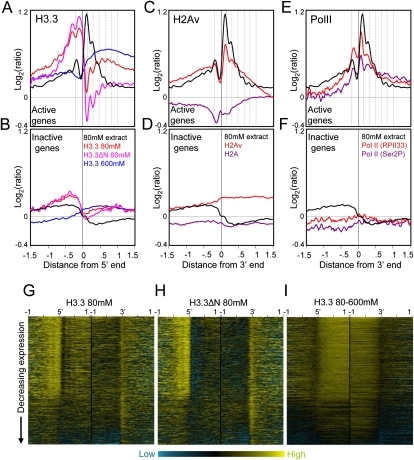
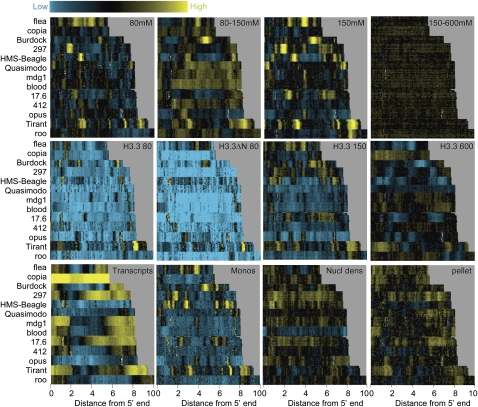
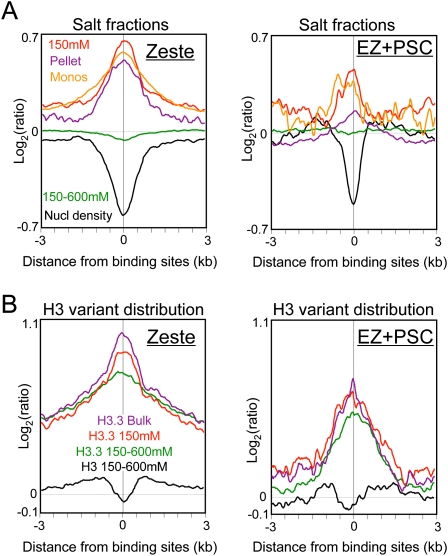
We applied genome-wide profiling to successive salt-extracted fractions of micrococcal nuclease-treated Drosophila chromatin. Chromatin fractions extracted with 80 mM or 150 mM NaCl after digestion contain predominantly mononucleosomes and represent classical "active" chromatin. Profiles of these low-salt soluble fractions display phased nucleosomes over transcriptionally active genes that are locally depleted of histone H3.3 and correspond closely to profiles of histone H2Av (H2A.Z) and RNA polymerase II. This correspondence suggests that transcription can result in loss of H3.3+H2Av nucleosomes and generate low-salt soluble nucleosomes. Nearly quantitative recovery of chromatin is obtained with 600 mM NaCl; however, the remaining insoluble chromatin is enriched in actively transcribed regions. Salt-insoluble chromatin likely represents oligonucleosomes that are attached to large protein complexes. Both low-salt extracted and insoluble chromatin are rich in sequences that correspond to epigenetic regulatory elements genome-wide. The presence of active chromatin at both extremes of salt solubility suggests that these salt fractions capture bound and unbound intermediates in active processes, thus providing a simple, powerful strategy for mapping epigenome dynamics.


Figures

Figure 1.
Figure 1.
DNA and protein characterization of S2 cell chromatin fractions. (A) Ethidium bromide–stained agarose gel showing a typical MNase ladder of DNA purified from MNase-treated nuclei (Nuclei); followed by ladders of DNA purified from the nuclear supernatant (Supn); successive 80 mM, 150 mM, and 600 mM extractions; and the remaining pellet, as indicated in the cartoon below. The average percentage of total chromatin isolated at each step is indicated. (B) SDS–polyacrylamide gel analysis (SDS-PAGE) of proteins in salt fractions. Equal aliquots of fractions from successive extraction steps in a typical experiment were loaded onto a 16% polyacrylamide gel, which was electrophoresed and stained with Sypro ruby for sensitive detection of histones (left). Restaining with Coomassie blue (right) shows that the pellet includes mostly high-molecular-weight proteins. (C) MNase ladders of 150 mM and 600 mM fractions from a typical pulldown experiment. (D) Western blot analysis of the RPII33 subunit of RNA polymerase II (Pol II) and histones in salt fractions. Equal aliquots of samples were loaded onto a 16% SDS-PAGE gel, electrophoresed, blotted, probed with rabbit RPII33 (Muse et al. 2007) and mouse pan-histone (Roche MAB052) antibodies, followed by IRD700 anti-rabbit and IRD800 anti-mouse secondary antibodies (LI-COR). After blotting, the gel was stained with Sypro ruby. RPII33 is enriched in the insoluble fraction relative to histones. Histone H1 is mostly extracted with the 600 mM fraction as expected (Davie and Saunders 1981). (E) Western blot analysis of the ISWI nucleosome remodeling protein in salt fractions. Equal aliquots of samples were loaded onto a 4%–12% NuPAGE (Invitrogen), gel electrophoresed and blotted to nitrocellulose, and probed with an ISWI antibody (Tsukiyama et al. 1995). Successive extractions release increasing amounts of ISWI, although most of the ISWI (MW 119) that is recovered resides in the insoluble fraction.
Figure 2.
Figure 2.
Salt-extracted chromatin fractions display different chromatin landscapes. Tracks show profiles for a typical gene-rich region of the fly genome. Salt-extracted chromatin fractions (brown), Pol II (green), and H3.3 (red) recovered from these fractions are all displayed on the same log2-ratio scale. Pol II tracks are calculated from published data for different Pol II epitopes: the RPII33 subunit, serine-2-phosphate on the C-terminal domain (CTD), and the unphosphorylated CTD (Muse et al. 2007; Misulovin et al. 2008). An expansion of a subregion is shown on the right. The 80–150 mM fraction derives from a 150 mM extraction following an 80 mM extraction, and the 150–600 mM fraction derives from a 600 mM extraction following a 150 mM extraction. All tracks represent single data sets; examples of tracks representing biological replicates of this region are shown in Supplemental Figure S1.
Figure 3.
Figure 3.
Active and inactive genes display contrasting profiles in salt-extracted chromatin fractions. (A) Ends analysis of chromatin extracted with 80 mM salt, divided into quintile groupings based on gene expression levels in Supplemental Table S1. Averages from eight independent experiments are shown. The 9247 genes for which both ends are known were aligned at their 5′ and their 3′ ends and averaged for each 25-bp interval on either side. Contributions from neighboring transcription units were omitted. (B) Same as A except that 150 mM fractions from three independent experiments were profiled, averaged, and plotted on the same scale. (C) Same as A except that the 150–600 mM fractions from three independent experiments were profiled, averaged, and plotted on the same scale. (D) Same as A except that pellet fractions from three independent experiments were profiled, averaged, and plotted on the same scale. (E) Ends analysis of mononucleosomes isolated by agarose gel purification from DNA obtained from MNased nucleosomes extracted using EDTA and shearing. An average from two experiments is shown. (F) Ends analysis profile of nucleosome density averaged from three independent experiments. (G) A representative heat map profile for 80 mM–extracted chromatin. The red arrowhead indicates the cutoff used to separate active from inactive genes for the analyses shown in Fig. 4. 5′ (left) and 3′ (right) end profiles for ±1 kb from single representative experiments are shown, ordered by decreasing expression, based on cDNA levels measured as a log-ratio over genomic DNA using the same array design as for chromatin profiling, with probes for each gene chosen algorithmically. Contributions from neighboring transcription units were omitted, which resulted in some horizontal gray streaks toward the upstream and downstream sides of each map. Contrast levels are equal for all stacks (Java TreeView setting of 2.0). (H) Same as G for a representative chromatin fraction extracted with 150 mM NaCl following an 80 mM extraction (80–150 mM). (I) Same as H for the corresponding pellet fraction.
Figure 4.
Figure 4.
H3.3-enriched low-salt soluble nucleosomes occupy active promoters. (A) Ends analyses of H3.3 obtained from salt fractions as indicated for active genes. H3.3 peaks are out-of-phase with low-salt soluble chromatin peaks (dotted vertical lines). (B) same as A except for inactive genes. To separate active and inactive genes, loci were rank-ordered based on expression levels in Supplemental Table S1. For simplicity, genes were divided into active and inactive fractions based on the visible discontinuity in salt solubility and H3.3 heat maps after rank-ordering by expression (Fig. 3G). For comparison, profiles are shown for 80 mM salt-extraction averaged from eight experiments (black curve). (C) Ends analyses of H2Av and H2A obtained by pulldown of biotin-tagged variants after a low-salt/EDTA/shearing extraction procedure (Jin and Felsenfeld 2007), showing active gene profiles. (D) Same as C except for inactive genes. (E) Ends analyses of Pol II ChIP-chip of S2 cell chromatin using RPII33 and Ser2P antibodies (Muse et al. 2007). Profiles for active genes are shown together with low-salt chromatin peaks (dotted lines), which align with but are slightly offset from Pol II peaks. (F) Same as E except for inactive genes. (G) Heat map display of H3.3/input for chromatin from an 80 mM extract. Contrast levels are equal for all stacks (Java TreeView setting of 2.0). (H) Same as G but for H3.3ΔN 80 mM. (I) Same as G but for the corresponding 80–600 mM extract.
Figure 5.
Figure 5.
Enrichment of low-salt soluble chromatin locally within transposons. Heat map stacks of 13 transposon families for salt fractions, H3.3, mononucleosomes, nucleosome density, and cDNAs, showing single representative samples. (Top row) Successive salt-extraction fractions (versus MNased nuclei) for 80 mM, 80–150 mM, 150 mM, and 150–600 mM extracts. (Second row) H3.3/input levels for 80 mM, 80 mM H3.3ΔN, 150 mM, and 600 mM pulldowns. (Third row) cDNA/genomic DNA from poly(A)+ RNAs, gel-purified mononucleosomes/input bulk DNA, MNased nuclei/genomic DNA, and pellet/nuclei after a 600 mM wash. Vertical gray streaks, most noticeable in the 600 mM stack, result from alignment gaps. Contrast levels are equal for all stacks (Java TreeView setting of 3.0).
Figure 6.
Figure 6.
Enrichment of low-salt soluble chromatin at epigenetic regulatory sites. (A) Genome-wide profiles of salt-fractionated soluble and insoluble nucleosomes for 1428 aligned Zeste (trxG) binding sites (left) and for 197 aligned Enhancer-of-Zeste and Primordial-sex-combs (EZ + PSC = PcG) binding sites (right). (B) Biotin-H3.3 and biotin-H3 variant distributions from bulk-extracted and salt-extracted samples.

References

    1. Ahmad K., Henikoff S. The histone variant H3.3 marks active chromatin by replication-independent nucleosome assembly. Mol. Cell. 2002;9:1191–1200. - PubMed
    1. Annunziato A.T., Schindler R.K., Thomas C.A., Jr, Seale R.L. Dual nature of newly replicated chromatin. Evidence for nucleosomal and non-nucleosomal DNA at the site of native replication forks. J. Biol. Chem. 1981;256:11880–11886. - PubMed
    1. Ausubel F.M., Brent R., Kingston R.E., Moore D.D., Seidman J.G., Smith J.A., Struhl K. Current protocols in molecular biology. Wiley; New York: 1994.
    1. Barski A., Cuddapah S., Cui K., Roh T.Y., Schones D.E., Wang Z., Wei G., Chepelev I., Zhao K. High-resolution profiling of histone methylations in the human genome. Cell. 2007;129:823–837. - PubMed
    1. Cooper E., Palmer R.J., Spaulding S.W. Effect of thyrotropin on 32P-labelled histones H1 and H3 in specific populations of nucleosomes in the thyroid. Nucleic Acids Res. 1981;9:3389–3401. - PMC - PubMed

Publication types

MeSH terms

LinkOut - more resources