Comparative Study
. 2008;3(12):e3952.
doi: 10.1371/journal.pone.0003952. Epub 2008 Dec 17.

Mucin dynamics in intestinal bacterial infection

Affiliations
Comparative Study

Mucin dynamics in intestinal bacterial infection

Sara K Lindén et al. PLoS One. 2008.

Abstract

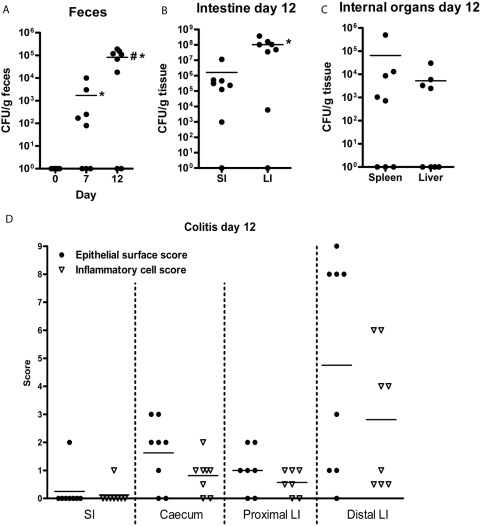
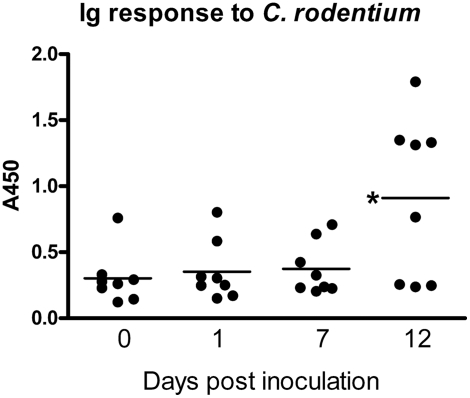
Background: Bacterial gastroenteritis causes morbidity and mortality in humans worldwide. Murine Citrobacter rodentium infection is a model for gastroenteritis caused by the human pathogens enteropathogenic Escherichia coli and enterohaemorrhagic E. coli. Mucin glycoproteins are the main component of the first barrier that bacteria encounter in the intestinal tract.

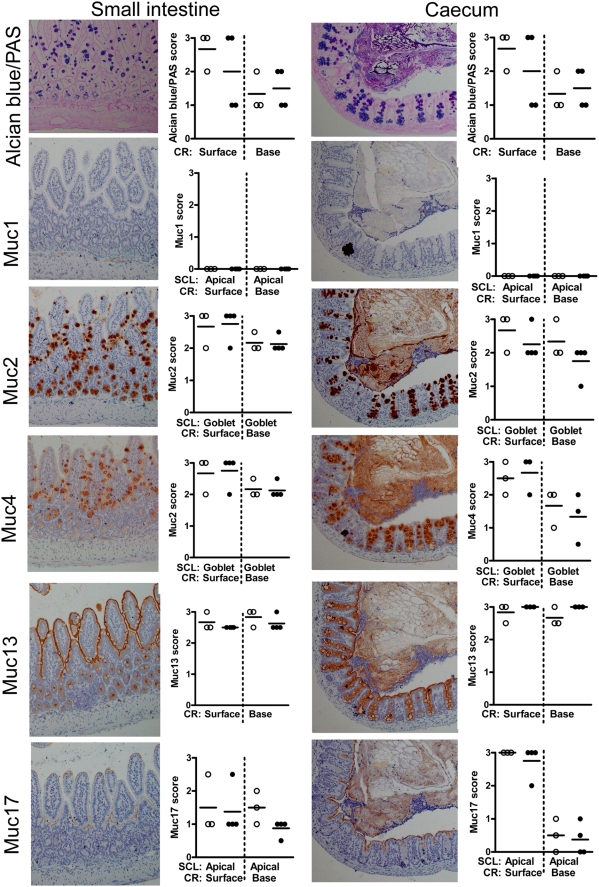
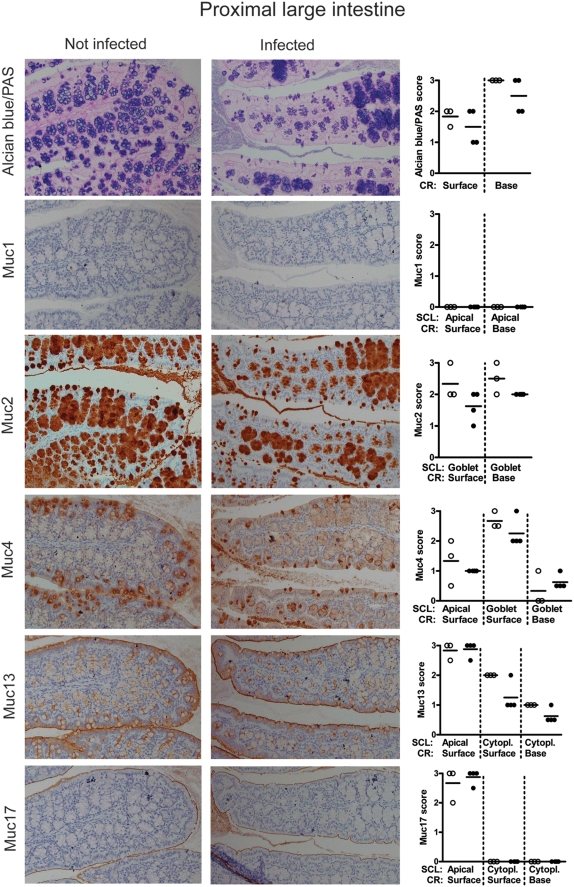
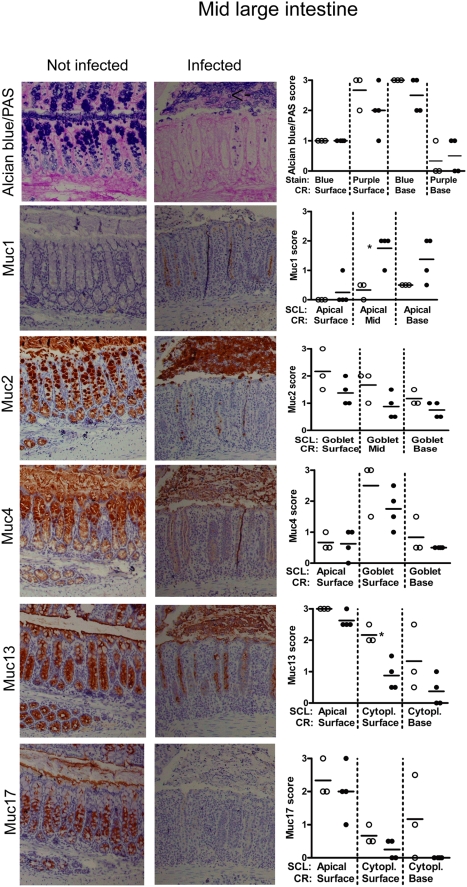
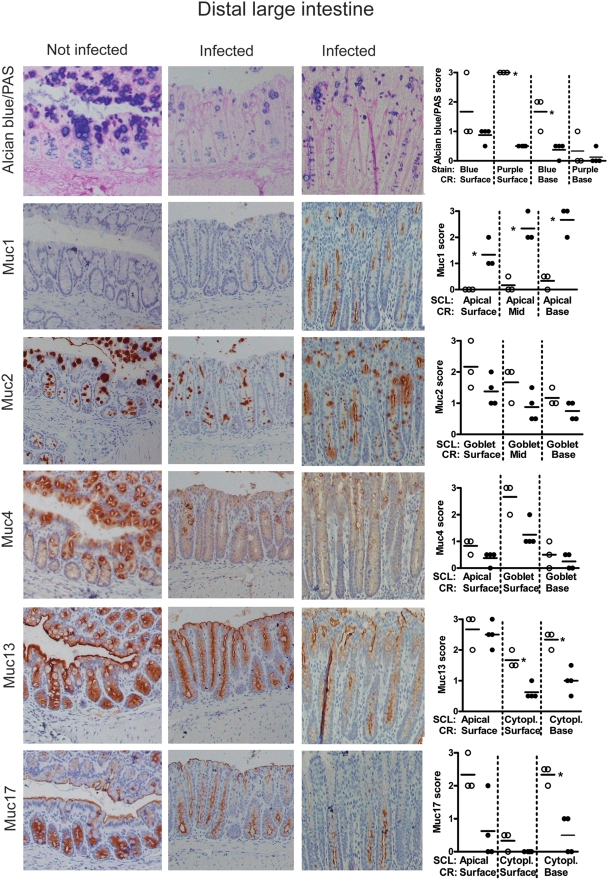
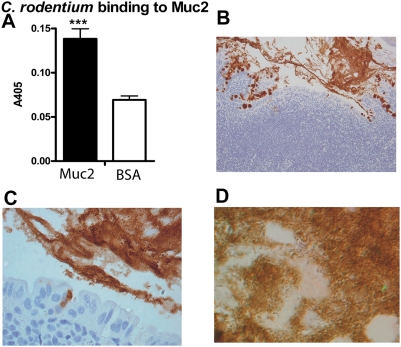
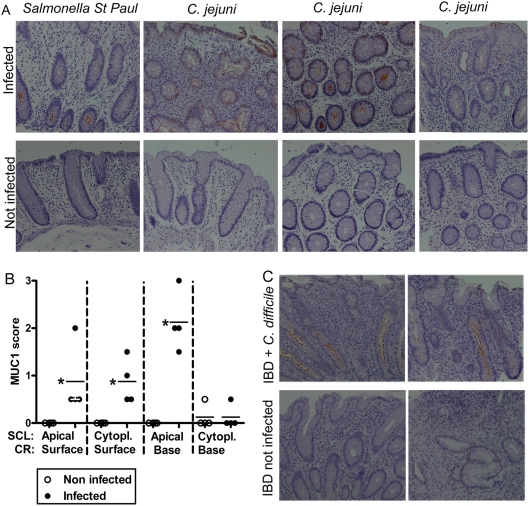
Methodology/principal findings: Using Immunohistochemistry, we investigated intestinal expression of mucins (Alcian blue/PAS, Muc1, Muc2, Muc4, Muc5AC, Muc13 and Muc3/17) in healthy and C. rodentium infected mice. The majority of the C. rodentium infected mice developed systemic infection and colitis in the mid and distal colon by day 12. C. rodentium bound to the major secreted mucin, Muc2, in vitro, and high numbers of bacteria were found in secreted MUC2 in infected animals in vivo, indicating that mucins may limit bacterial access to the epithelial surface. In the small intestine, caecum and proximal colon, the mucin expression was similar in infected and non-infected animals. In the distal colonic epithelium, all secreted and cell surface mucins decreased with the exception of the Muc1 cell surface mucin which increased after infection (p<0.05). Similarly, during human infection Salmonella St Paul, Campylobacter jejuni and Clostridium difficile induced MUC1 in the colon.

Conclusion: Major changes in both the cell-surface and secreted mucins occur in response to intestinal infection.


Conflict of interest statement

Competing Interests: The authors have declared that no competing interests exist.

Figures

Figure 1
Figure 1. C. rodentium induced colitis and infection load.
The number of C. rodentium CFU in feces increased over time (A, * p<0.05 compared to pre-inoculation, # p<0.05 compared to day 7, Mann Whitney U test, n = 8). At day 12, a higher number of CFU was detected in the large intestine (LI) than in the small intestine (SI) (B,* p<0.05), and low numbers of CFU were found in the internal organs (C). Histological colitis scores were low to moderate, with the distal large intestine being worst affected (D).
Figure 2
Figure 2. Serum Ig response to C. rodentium.
Serum concentrations of Ig reactive with C. rodentium lysate determined by ELISA in 8 mice prior to and 1, 7 and 12 days following infection.
Figure 3
Figure 3. Tissue localization of mucins in small intestine and caecum.
Histologically, the small intestinal villi and caecal crypts are covered by a simple columnar epithelium consisting of enterocytes with interspersed goblet cells. Using immunohistochemistry, we demonstrated that the apical surface of small intestine and caecal epithelia are lined by the cell surface mucins Muc13 and Muc17 as well as a small amount of Muc4 (brown). The goblet cells contain alcian blue positive material (blue), which mainly is Muc2 (brown), but also some Muc4. The photographs were taken using a 20× magnification. The quantification scores for any of these mucins were not significantly different between non-infected mice (○) and mice infected with C. rodentium for 12 days (•) in these areas of the intestine. (Mann Whitney U test, n = 7). SCL = subcellular localization, RC = region of crypt. The mucin stains are shown in serial sections on the same tissue area, whereas the mucin stain scores represent the average stain scores for the entire specimen for each individual mouse.
Figure 4
Figure 4. Tissue localization of mucins in the proximal large intestine.
The apical surface of the epithelial cells of the crypts in the leaf-like folds of the proximal large intestine is lined by the cell surface mucins Muc4, Muc13 and Muc17 (brown). The goblet cells contain Alcian blue positive material (blue), which mainly is Muc2 (brown), although the goblet cells of the surface also contain Muc4. The photographs were taken using a 20× magnification. The quantification scores for any of these mucins were not significantly different between non-infected mice (○) and mice infected with C. rodentium for 12 days (•) in these areas of the intestine. (Mann Whitney U test, n = 7). SCL = subcellular localization, RC = region of crypt. The mucin stains are shown in serial sections on the same tissue area, whereas the mucin stain scores represent the average stain scores for the entire specimen for each individual mouse.
Figure 5
Figure 5. Tissue localization of mucins in the mid large intestine.
The apical surface of the mid large intestinal epithelium and crypts are lined by the cell surface mucins Muc13 and Muc17 as well as a small amount of Muc4 (brown). The goblet cells contain Alcian blue positive material (blue = highly charged carbohydrate structures, purple = medium charged carbohydrate structures), which mainly is Muc2 (brown) and Muc4. The photographs were taken using a 20× magnification. The quantification scores for Muc1, and Muc13 were significantly different between non-infected mice (○) and mice infected with C. rodentium for 12 days (•) (* p<0.05, Mann Whitney U test, n = 7). SCL = subcellular localization, RC = region of crypt. The mucin stains are shown in serial sections on the same tissue area, whereas the mucin stain scores represent the average stain scores for the entire specimen for each individual mouse.
Figure 6
Figure 6. Tissue localization of mucins in the distal large intestine.
The apical surface of the distal large intestinal epithelium and crypts are lined by the cell surface mucins Muc13 and Muc17 as well as a small amount of Muc4 (brown). The goblet cells contain Alcian blue positive material (blue = highly charged carbohydrate structures, purple = medium charged carbohydrate structures), which mainly is Muc2 (brown), although the goblet cells of the surface also contain Muc4. The photographs were taken using a 20× magnification. The quantification scores for Alcian blue, Muc1, Muc13 and Muc17 were significantly different between non-infected mice (○) and mice infected with C. rodentium for 12 days (•) (* p<0.05, Mann Whitney U test, n = 7). SCL = subcellular localization, RC = region of crypt. The mucin stains are shown in serial sections on the same tissue area, whereas the mucin stain scores represent the average stain scores for the entire specimen for each individual mouse.
Figure 7
Figure 7. C. rodentium binding to Muc2.
ELISA plates were coated with the “insoluble” Muc2 complex or with BSA and incubated with biotinylated C. rodentium. Statistics: Mean±SD, *** p<0.001 (t-test, n = 6) (A). Large amounts of bacteria can be found entangled in the secreted Muc2 in C. rodentium infected animals (B–D). By brightfield observation using a 20× lens (B) the Muc2 is visualized as a brown stain, and the presence of large amounts of bacteria within the secreted Muc2 can be seen by reflected light Nomarski differential interference observation (C; 40× lens and D; 100× lens).
Figure 8
Figure 8. Induction of MUC1 in human intestinal infection.
MUC1 expression in distal colon in humans with S. St Paul (upper left panel) and C. jejuni (3 upper right panels) gastroenteritis (A). The lower panels show lack of MUC1 in non-infected age, sex and colonic site matched controls. The MUC1 quantification scores (B) were higher in colonic biopsies from infected (•) than non-infected (○) patients (* p<0.05, Mann Whitney U test, n = 8). Colonic biopsies from two IBD patients with acute C. difficile infection demonstrated that MUC1 is higher during infection even in the background of chronic inflammation. The photographs were taken using 20× magnification.

References

    1. Tobe T, Sasakawa C. Species-specific cell adhesion of enteropathogenic Escherichia coli is mediated by type IV bundle-forming pili. Cell Microbiol. 2002;4:29–42. - PubMed
    1. Mundy R, Schuller S, Girard F, Fairbrother JM, Phillips AD, et al. Functional studies of intimin in vivo and ex vivo: implications for host specificity and tissue tropism. Microbiology. 2007;153:959–967. - PMC - PubMed
    1. Mundy R, MacDonald TT, Dougan G, Frankel G, Wiles S. Citrobacter rodentium of mice and man. Cellular Microbiology. 2005;7:1697–1706. - PubMed
    1. MacDonald TT, Frankel G, Dougan G, Goncalves NS, Simmons C. Host defences to Citrobacter rodentium. Ijmm International Journal of Medical Microbiology. 2003;293:87–93. - PubMed
    1. McGuckin MA, Every A, Skene C, Linden S, McAuley J, et al. Muc1 mucin limits both Helicobacter pylori colonization of the murine gastric mucosa and the associated gastritis. Gastroenterology. 2007;133:1210–1218. - PubMed

Publication types

MeSH terms