. 2009 Mar 15;124(6):1285-92.
doi: 10.1002/ijc.24087.

Activator protein 2 alpha (AP2alpha) suppresses 42 kDa C/CAAT enhancer binding protein alpha (p42(C/EBPalpha)) in head and neck squamous cell carcinoma

Affiliations

Activator protein 2 alpha (AP2alpha) suppresses 42 kDa C/CAAT enhancer binding protein alpha (p42(C/EBPalpha)) in head and neck squamous cell carcinoma

Kristi L Bennett et al. Int J Cancer. .

Abstract

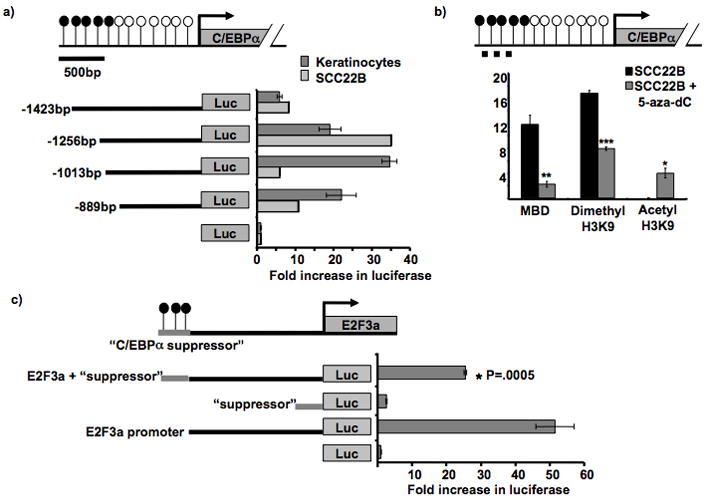
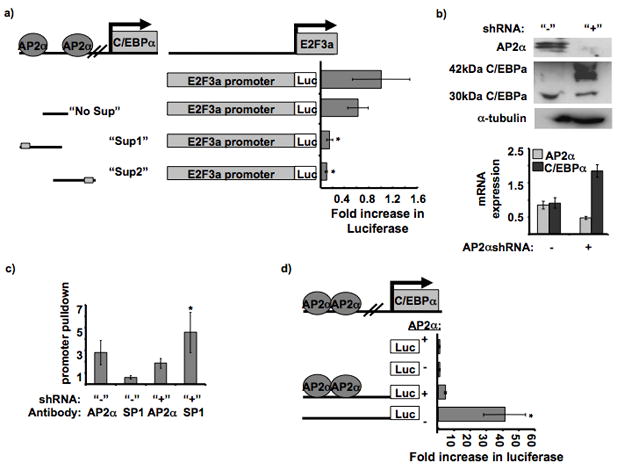
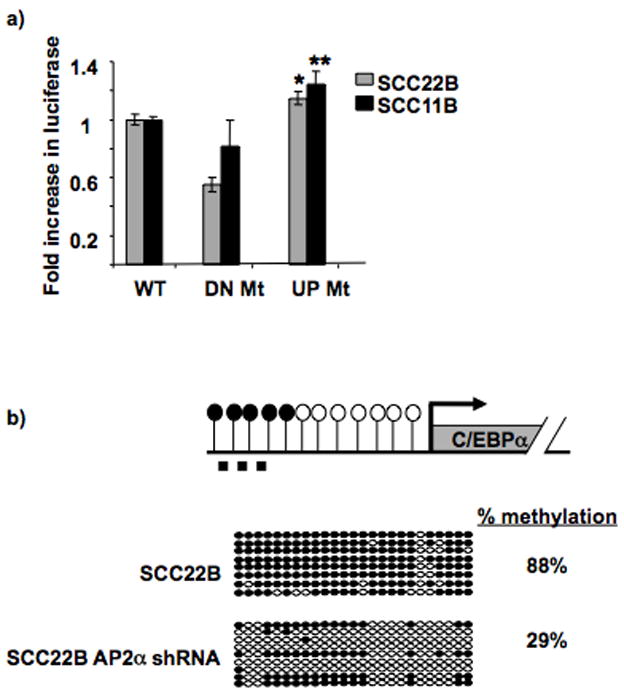
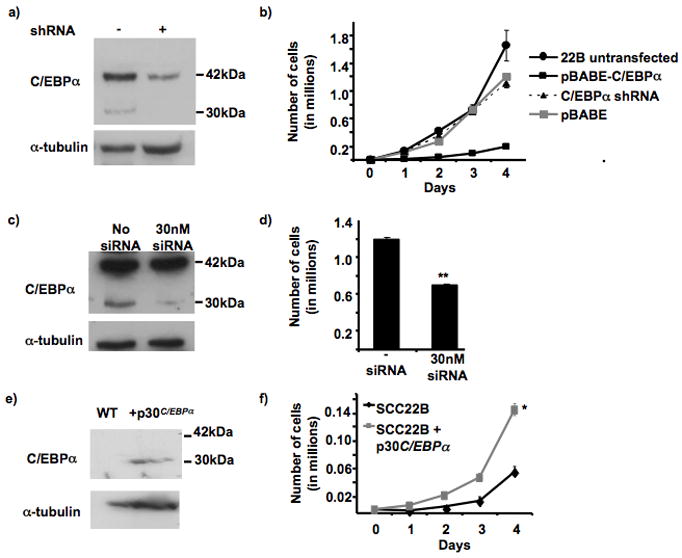
The tumor suppressor C/CAAT enhancer binding protein alpha (C/EBPalpha) is a transcription factor involved in cell cycle control and cellular differentiation. A recent study showed that C/EBPalpha is frequently downregulated in head and neck squamous cell carcinoma (HNSCC) by DNA methylation in an upstream regulatory region. Here, we investigated how DNA methylation in the upstream regulatory region disrupts the transcriptional regulation of C/EBPalpha in HNSCC. The results reveal that aberrant methylation correlates with methyl binding domain protein binding and repressive histone modifications. This methylated region contains previously uninvestigated AP2alpha binding sites. AP2alpha suppresses C/EBPalpha promoter activity and protein expression. Interestingly, silencing AP2alpha by shRNA increases the antiproliferative isoform of C/EBPalpha (p42(C/EBPalpha)). Furthermore, growth analysis revealed that these 2 isoforms yield very different proliferative properties in HNSCC.


Figures

Figure 1
Figure 1. C/EBPα methylation and promoter analyses in cell lines
a. C/EBPα promoter assay in HaCat, an immortalized keratinocyte cell line, and SCC22B, a HNSCC cell line. Diagram is drawn to scale and depicts C/EBPα and its upstream sequence. CpG sites’ methylation status is shown by open (unmethylated) and closed (methylated) circles. Constructs contained different lengths of the C/EBPα upstream promoter in front of the luciferase gene in pGL3 basic. Promoter activity (plotted on the x-axis) is measured as the fold increase in the luciferase/renilla ratio in respect to the negative control (pGL3 vector only). The −1423bp construct provided a significant decrease in promoter activity, * P = 0.0028. b. Quantitative ChIP PCR on HNSCC cells to detect pulldown from MBD and histone dimethylation before and after 5-aza-dC treatment. Diagram depicts C/EBPα and its upstream sequence. CpG sites’ methylation status is shown by open (unmethylated) and closed (methylated) circles. The dashed line represents the region analyzed for promoter pulldown in the ChIP assay. C/EBPα promoter pulldown enrichment (in SCC22B cells before and after 5- aza-2′-deoxycitidine treatment) by MBD2/3, dimethyl H3K9, or acetyl H3K9 antibodies was normalized to the negative (no antibody) control. * P = 0.0003; ** P = 0.0002; *** P = 3 × 10⁻⁶. c. C/EBPα suppressor promoter assay in SCC22B cells. Diagram depicts the “C/EBPα suppressor sequence” (−1423bp to −1256bp) cloned in front of 2kb upstream E2F3a sequence. Promoter activity (plotted on the x-axis) is measured as the fold increase in luciferase/renilla ratio in respect to the negative control (pGL3 basic vector only). The suppressor construct contained −1423bp to −1256bp of upstream C/EBPα sequence cloned into pGL3 basic; the E2F3a/suppressor construct contained −1423bp to −1256bp of upstream C/EBPα sequence cloned in front of a strong E2F3a promoter sequence within pGL3 basic.
Figure 2
Figure 2. AP2α suppresses C/EBPα promoter activity
a. Effect of different parts of the C/EBPα suppressor sequence on E2F3a promoter activity. Diagram of the suppressor constructs and location of the AP2α binding sites. The different suppressor parts were cloned in front of the E2F3a promoter sequence in pGL3 basic. The luciferase values were normalized to the E2F3a promoter construct. The “Sup 1” and “Sup 2” constructs provided significantly less promoter activity than the “No Sup” and WT promoter constructs, * P = 0.0043 and 0.0048, respectively. b. AP2α stable silencing and C/EBPα upregulation in SCC22B cell line. A short hairpin sequence targeting AP2α was cloned into pRS stable silencing vector. The western blot contains 300,000 untransfected SCC22B cells and 300,000 SCC22B cells transfected with the AP2α shRNA. The blot was probed with AP2α antibody,α-tubulin (internal control), and C/EBPα. Also, cDNA was prepared from RNA isolated from the respective cells. Quantitative RT-PCR data is shown for normalized AP2α and C/EBPα expression in SCC22B cells with and without AP2α shRNA. P = 0.0201 and 0.0121, respectively. c. SP1 binding is inhibited by AP2α binding to the upstream C/EBPα sequence. Quantitative RT-PCR on C/EBPα promoter pulldown (−1423 to −1243 bp) with AP2α and SP1 antibodies in SCC22B cells before and after AP2α silencing. C/EBPαpromoter pulldown enrichment was normalized to the negative (no antibody) control. * P = 0.0451. d. C/EBPα promoter activity before and after AP2α silencing. The promoter assay was performed in SCC22B cells (“+AP2α”) and SCC22B cells with downregulated AP2α (“−AP2α”). The promoter constructs contained −1423 bp of upstream C/EBPα sequence. Fold increase in luciferase activity was normalized to the negative control in each cell lysate (empty pGL3 basic). Promoter activity was significantly increased in the cell lysates with decreased AP2α expression. * P = 0.0237.
Figure 3
Figure 3. AP2α site mutagenesis or protein downregulation increases C/EBPα promoter activity and decreases upstream methylation, respectively
a. AP2α site mutagenesis increases C/EBPα promoter activity. The graph displays the relative fold increase in luciferase activity with the C/EBPα promoter constructs containing the mutation in the upstream AP2α site (−1419 bp; “UP Mt”) compared to the WT promoter (“WT”; which is set as 1) in both SCC11B and 22B. The previously identified downstream AP2α site (−311bp; “DN Mt”) which does not suppress C/EBPα promoter activity in HNSCC was mutated as a control, and it showed no increase in promoter activity compared to “WT”. * P = 0.032; ** P = 0.031. Black bars = SCC11B; Gray bars = SCC22B. b. AP2α downregulation provides decreased upstream C/EBPα methylation. Diagram depicts C/EBPα and its upstream sequence. CpG sites’ methylation status is shown by open (unmethylated) and closed (methylated) circles. The dashed line represents the region analyzed by bisulfite sequencing (−1423bp to −1121bp). Bisulfite sequencing analysis was performed on SCC22B cells before and after AP2α stable shRNA silencing. The region tested for methylation via bisulfite sequencing spans from −1423 bp to −1121 bp. Bisulfite sequencing was performed by comparing the sequences with 100% and 0% methylated DNA sequence (i.e. CG or TG at CpG sites, respectively). Open circles represent unmethylated CpGs, and closed circles represent methylated CpGs. Each row represents an individual clone. Percentage methylation is shown for the two cell types.
Figure 4
Figure 4. C/EBPα silencing and p30 C/EBPα-overexpression in SCC22B cells
a. Confirmation of C/EBPα silencing in C/EBPα-overexpressing SCC22B cells. Western blot showing C/EBPα-overexpressing SCC22B cells before and after stable C/EBPα silencing. 150,000 cells were loaded in each lane. The blot was first probed with C/EBPα followed by α-tubulin to confirm equal loading. Semi-quantitation was performed using Image Quant computer software, which provided that 75% downregulation of the 42 kDa isoform was attained. b. Growth curve analysis of C/EBPα-overexpressing SCC22B cells after stable C/EBPα silencing. 10,000 cells (SCC22B; SCC22B + pBABE only; SCC22B C/EBPα-overexpressing cells; and SCC22B C/EBPα-overexpressing + C/EBPα shRNA) were plated in triplicates in a 6 well plate. Cells were permitted to grow three days after plating before taking the first count (Day 1). Growth was assessed by counting the cells every 24 hrs for 4 days. For each count, 500 μl of trypsin was added to each well for 3 min, after which the cells were suspended in 2 mls of PBS, and 500 μl was counted using a Coulter counter. ** P = 0.0002. c. Confirmation of 30kDa C/EBPα silencing in C/EBPα-overexpressing SCC22B cells. Western blot showing C/EBPα-overexpressing SCC22B cells with and without 30 nM siRNA. 150,000 cells were loaded in each lane. The blot was first probed with C/EBPα followed by α-tubulin to confirm equal loading. d. Cell count of C/EBPα-overexpressing SCC22B cells after transient 30kDa C/EBPα silencing. Cells were collected and counted 72 hrs after transfection using a Coulter counter. ** p < .0007. e. Confirmation of p30C/EBPα overexpression in SCC22B cells. Western blot showing SCC22B cells with or without pBABE-p30C/EBPα. 150,000 cells were loaded in each lane. The blot was first probed with C/EBPα followed by α-tubulin to confirm equal loading. f. Growth curve analysis of p30C/EBPα overexpressing SCC22B cells. 5,000 cells (SCC22B + pBABE and SCC22B + p30C/EBPα) were plated in triplicates in a 6 well plate. Growth was assessed by counting the cells every 24 hrs for 4 days. For each count, 500 μl of trypsin was added to each well for 3 min, after which the cells were suspended in 2 ml of PBS, and 500 μl was counted using a Coulter counter. * p-value < 0.0007.

Similar articles

Cited by

References

    1. Schrem H, Klempnauer J, Borlak J. Liver-enriched transcription factors in liver function and development. Part II: the C/EBPs and D site-binding protein in cell cycle control, carcinogenesis, circadian gene regulation, liver regeneration, apoptosis, and liver-specific gene regulation. Pharmacol Rev. 2004;56:291–330. - PubMed
    1. Johnson PF. Molecular stop signs: regulation of cell-cycle arrest by C/EBP transcription factors. J Cell Sci. 2005;118:2545–55. - PubMed
    1. Hsieh CC, Xiong W, Xie Q, Rabek JP, Scott SG, An MR, Reisner PD, Kuninger DT, Papaconstantinou J. Effects of age on the posttranscriptional regulation of CCAAT/enhancer binding protein alpha and CCAAT/enhancer binding protein beta isoform synthesis in control and LPS-treated livers. Mol Biol Cell. 1998;9:1479–94. - PMC - PubMed
    1. Porse BT, Bryder D, Theilgaard-Monch K, Hasemann MS, Anderson K, Damgaard I, Jacobsen SE, Nerlov C. Loss of C/EBP alpha cell cycle control increases myeloid progenitor proliferation and transforms the neutrophil granulocyte lineage. J Exp Med. 2005;202:85–96. - PMC - PubMed
    1. Halmos B, Huettner CS, Kocher O, Ferenczi K, Karp DD, Tenen DG. Down-regulation and antiproliferative role of C/EBPalpha in lung cancer. Cancer Res. 2002;62:528–34. - PubMed

Publication types

MeSH terms