. 2009 Jan 15;115(2):363-72.
doi: 10.1002/cncr.24004.

Validation of a new prognostic index for patients with chronic lymphocytic leukemia

Affiliations

Validation of a new prognostic index for patients with chronic lymphocytic leukemia

Tait D Shanafelt et al. Cancer. .

Abstract

Background: The clinical course of chronic lymphocytic leukemia (CLL) is highly variable. A prognostic index based on widely available clinical and laboratory features was recently developed to predict survival among patients with previously untreated CLL. This index requires validation in an independent series of patients before widespread use can be recommended.

Methods: The Mayo Clinic CLL database was used to evaluate the validity and reproducibility of the new prognostic index.

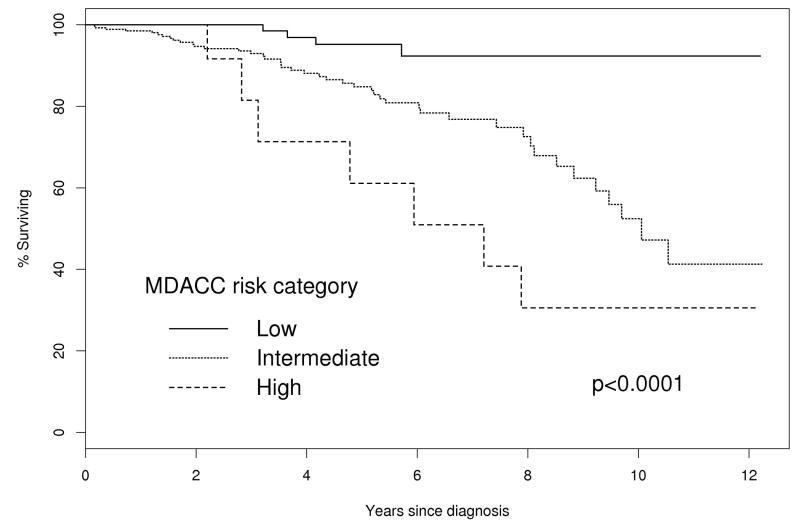
Results: A total of 440 patients with newly diagnosed CLL who were seen at the Mayo Clinic within 12 months of diagnosis and for whom data were available with which to calculate index score were identified. Patients were classified as low, intermediate, or high risk using the prognostic index. The estimated median survival times were: not reached for low risk, 10.1 years for intermediate risk, and 7.2 years for high risk. The estimated median and 5-year survival by prognostic index risk category were similar to those originally reported. The prognostic index risk category added predictive value beyond that of Rai risk alone (P=.004). The prognostic index risk category remained a predictor of survival when analysis was limited to Rai stage 0 (P=.03) and nonreferred patients (P<.0001) and also predicted time to treatment (P<.0001).

Conclusions: The results of the current study confirm the ability of a newly developed prognostic index to predict survival among patients with previously untreated CLL. The study also extended the utility of the index by demonstrating that it is useful at diagnosis, retains prognostic value when applied exclusively to Rai stage 0 patients, is effective in nonreferred patients, and predicts time to treatment.


Figures

Figure 1
Figure 1. Patient Survival
A. Kaplan-Meier estimate of overall survival: Solid line indicates the overall survival for newly diagnosed patients (n=440). Dashed lines indicate the 95% confidence interval. Median = 10.5 years (95% CI, > 9.7 years). B. Kaplan-Meier estimate of time to treatment. Solid line indicates the time to treatment for newly diagnosed patients (n = 440). Dashed lines indicate the 95% C.I., median, 6.6 years (95% C.I. > 4.94 years). C: Relationship between estimated probability survival at 5 years by nomogram score and actual 5 year survival.
Figure 2
Figure 2. Overall survival by stage and prognostic index risk category
A. Kaplan-Meier estimate of overall survival by Prognostic Index Category (n=440) B: Kaplan-Meier estimate of overall survival by Rai risk category (n=440) C. Kaplan-Meier estimate of Time to Treatment by Prognostic Index Category (n=440) D. Kaplan-Meier estimate of Time to Treatment by Prognostic Index Category Rai 0 Patients (n=261; high risk group not shown, n=2)

References

    1. Jemal A, Siegel R, Ward E, et al. Cancer statistics, 2006. CA Cancer J Clin. 2006;56:106–30. - PubMed
    1. Morton LM, Wang SS, Devesa SS, et al. Lymphoma incidence patterns by WHO subtype in the United States, 1992-2001. Blood. 2006;107:265–76. - PMC - PubMed
    1. Rai KR, Sawitsky A, Cronkite EP, et al. Clinical staging of chronic lymphocytic leukemia. Blood. 1975;46:219–34. - PubMed
    1. Rai K. A critical analysis of staging in CLL. New York: Alan R Liss; 1987.
    1. Binet JL, Lepoprier M, Dighiero G, et al. A clinical staging system for chronic lymphocytic leukemia: prognostic significance. Cancer. 1977;40:855–64. - PubMed

Publication types