. 2008 Dec;31(12):1647-54.
doi: 10.1093/sleep/31.12.1647.

Modafinil increases arousal determined by P13 potential amplitude: an effect blocked by gap junction antagonists

Affiliations

Modafinil increases arousal determined by P13 potential amplitude: an effect blocked by gap junction antagonists

Paige Beck et al. Sleep. 2008 Dec.

Abstract

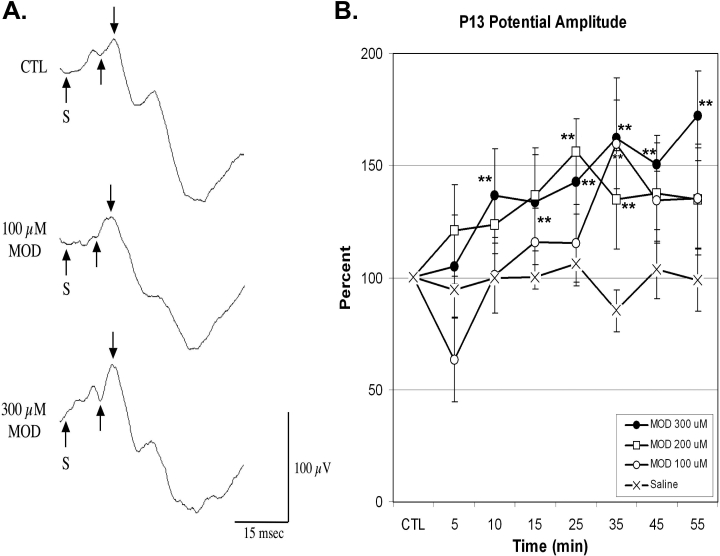
Study objectives: We recorded the effects of administration of the stimulant modafinil on the amplitude of the sleep state-dependent auditory P13 evoked potential in freely moving rats, a measure of arousal thought to be generated by the cholinergic arm of the reticular activating system, specifically the pedunculopontine nucleus (PPN).

Design: Groups of rats were implanted for recording auditory evoked responses and the effects on P13 potential amplitude of intracranial injections into the PPN of neuroactive agents determined.

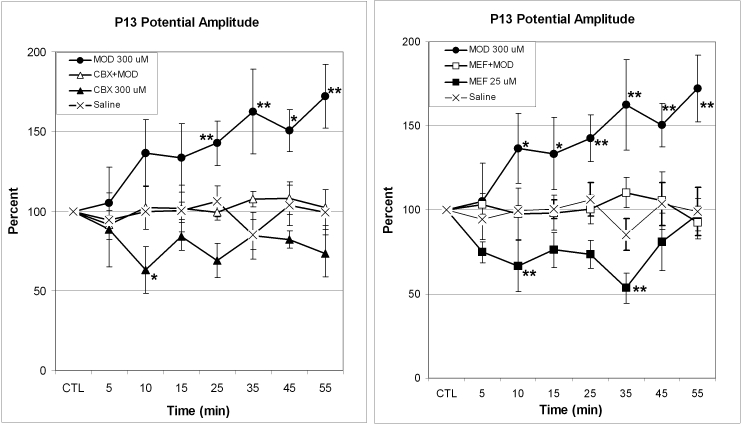
Measurements and results: The effects of intracranial injections into the PPN of modafinil showed that P13 potential amplitude increased in a dose-dependent manner at doses of 100, 200, and 300 microM. The effect was blocked by pretreatment with either of the gap junction antagonists carbenoxolone (300 microM) or mefloquine (25 microM), which by themselves slightly decreased P13 potential amplitude.

Conclusions: These results suggest that modafinil increases arousal levels as determined by the amplitude of the P13 potential, an effect blocked by gap junction antagonists, suggesting that one mechanism by which modafinil increases arousal may be by increasing electrical coupling.


Figures

Figure 1
Figure 1
Effects of MOD on P13 potential amplitude. A. Representative averages from a single rat showing a control average (top record), one 25 min after intracranial MOD at 100 μM (middle record), and one 25 min after MOD at 300 μM (bottom record). The stimuli were applied at the arrow labeled S, and the amplitude of the P13 potential was measured between the second and third arrows, at the peak of the potential, approximately 13 msec after the stimulus. Calibration bars as shown. B.Percent change in P13 potential amplitude in a group of 8 rats recorded from 5–55 min after injection of saline or vehicle (X), after MOD at 100 μM (open circles), after 200 μM (open squares), and after 300 μM (filled circles). Note that the CTL value is 100% for every injection, i.e., saline, 100, 200, or 300 μM MOD, and post injection comparisons were made against these controls. The asterisks denote significant (P < 0.01) increases compared to pre-injection control using a repeated measures one-way ANOVA (2-way results provided in the text), showing significance at 35 min after 100 μM, at 25 and 35 min after 200 μM, and at 10–55 min after 300 μM MOD.
Figure 2
Figure 2
Effects of gap junction antagonists on MOD-induced changes on P13 potential amplitude. A. Percent change in average P13 potential amplitude after saline (X), and after MOD at 300 μM (filled circles, see significance in Figure 1B), as well as after CBX alone at 300 μM (filled triangles) and CBX at 300 μM followed 20 min later by MOD at 300 μM (open triangles) compared to pre-injection control for each agent. CBX alone (filled triangles) induced transient decreases compared to saline alone at 10, 25, and 55 min (P < 0.01, asterisks not shown for clarity), while pretreatment with CBX blocked the effects of MOD at all time points (open triangles) and was not different from saline (X). When a 3-factor, 2-way analysis between MOD at 300 μM (filled circles), CBX at 300 μM (filled triangles) and CBX+MOD (open triangles) was done (preand post injection values at all time points after MOD vs CBX vs CBX+MOD), significant increases were present for MOD vs CBX+MOD at 25, 35, and 55 min (**P < 0.01), as well as 45 min (*P < 0.05) (upper asterisks in Fig. 2A), suggesting the presence of CBX suppressed the increases seen with MOD alone (shown in Fig. 1B). Comparison between CBX and CBX+MOD showed only significance at 10 min (*P < 0.05, asterisk at bottom of Fig. 2A). Significant differences between MOD alone and CBX alone were present at 10–55 min (P < 0.01, asterisks not shown for clarity). B.Percent change in average P13 potential amplitude after saline (X), and after MOD at 300 μM (filled circles), as well as after MEF alone at 25 μM (filled squares) and MEF at 25 μM followed 20 min later by MOD at 300 μM (open squares) compared to pre-injection control for each agent. One-way ANOVA comparison between MEF alone and saline induced significant decreases at 5, 10, 15, 25, 35 ( P < 0.01), and 45 min (P < 0.05) (asterisks not shown for clarity), but pretreatment with MEF blocked the effects of MOD at all time points (open squares) and was not different from saline (X). When a 3-factor, 2-way analysis (pre- and post injection values at all time points after MOD vs MEF vs MEF+MOD between MOD at 300 μM (filled circles) and MEF+MOD (open squares) was done, significant increases were present comparing MOD vs MEF+MOD at 10 and 15 min (*P < 0.05) and 25–55 min (**P < 0.01) (upper asterisks in Fig. 2B), suggesting the presence of MEF suppressed the increases seen with MOD alone (as shown in Fig. 1B). When MEF vs MEF+MOD were compared, significant decreases were present only at 10 and 35 min (**P < 0.01) (lower asterisks in Fig. 2B). Significant differences between MOD alone and MEF alone were present at 10–55 min (P < 0.01, asterisks not shown for clarity).

Comment in

  • Gaps that wake you up.
    Siegel JM. Siegel JM. Sleep. 2008 Dec;31(12):1625-6. doi: 10.1093/sleep/31.12.1625. Sleep. 2008. PMID: 19090316 Free PMC article. No abstract available.

References

    1. Heister DS, Hayar A, Charlesworth A, Yates C, Zhou Y, Garcia-Rill E. Evidence for electrical coupling in the SubCoeruleus (SubC) nucleus. J Neurophysiol. 2007;97:3142–7. - PMC - PubMed
    1. Garcia-Rill E, Heister DS, Ye M, Charlesworth A, Hayar A. Electrical coupling: novel mechanism for sleep-wake control. Sleep. 2007;30:1405–14. - PMC - PubMed
    1. Urbano FJ, Leznik E, Llinas R. Modafinil enhances thalamocortical activity by increasing neuronal electrotonic coupling. Proc Natl Acad Sci U S A. 2007;104:12554–9. - PMC - PubMed
    1. Miyazato H, Skinner RD, Reese NB, Boop FA, Garcia-Rill E. A middle-latency auditory-evoked potential in the rat. Brain Res Bull. 1995;37:247–55. - PubMed
    1. Miyazato H, Skinner RD, Cobb M, Andersen B, Garcia-Rill E. Midlatency auditory evoked potentials in the rat effects of interventions which modulate arousal. Brain Res Bull. 1999;48:545–53. - PubMed

Publication types