. 2008 Dec 16;6(12):e307.
doi: 10.1371/journal.pbio.0060307.

Root system architecture from coupling cell shape to auxin transport

Affiliations

Root system architecture from coupling cell shape to auxin transport

Marta Laskowski et al. PLoS Biol. .

Erratum in

  • PLoS Biol. 2014 Oct;12(10):e1001984

Abstract

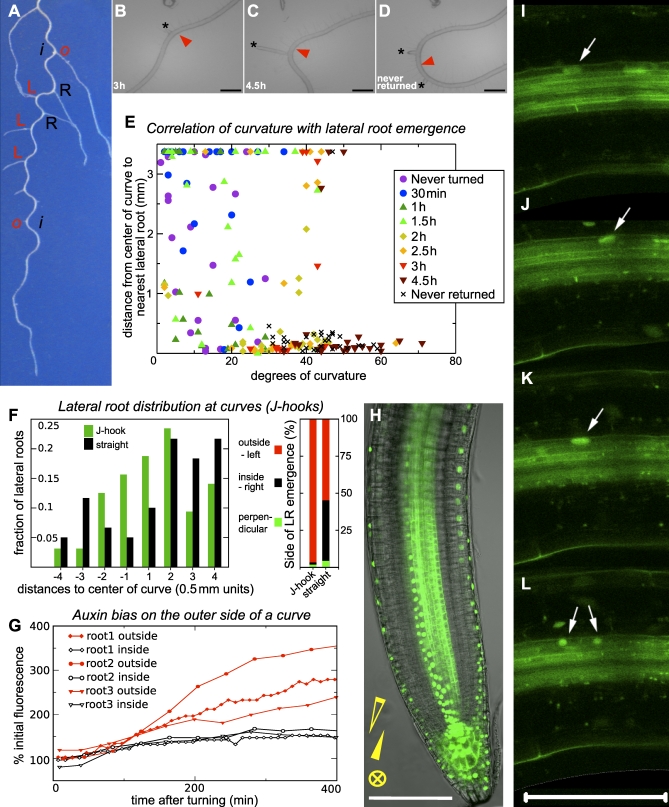
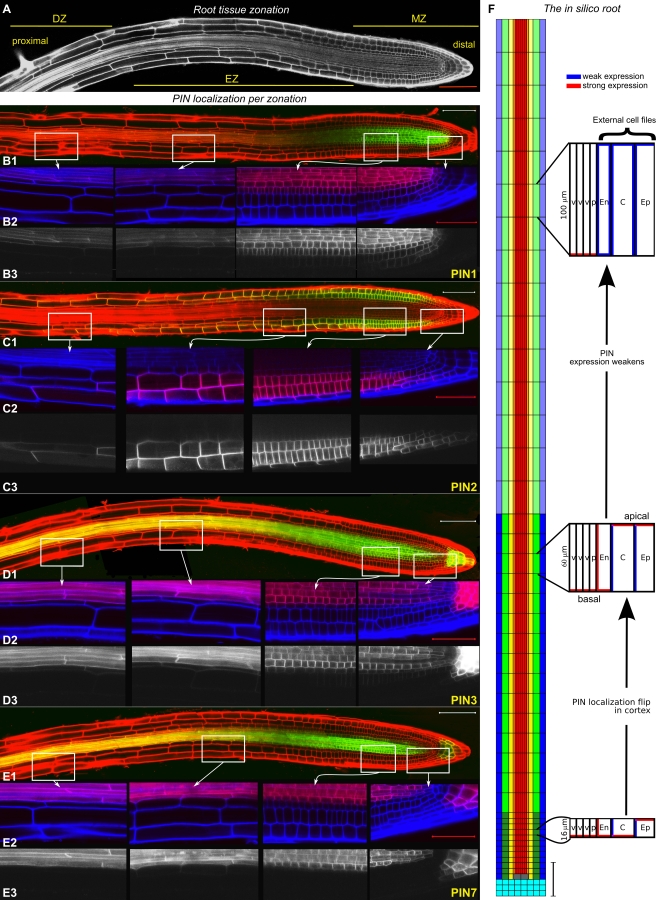
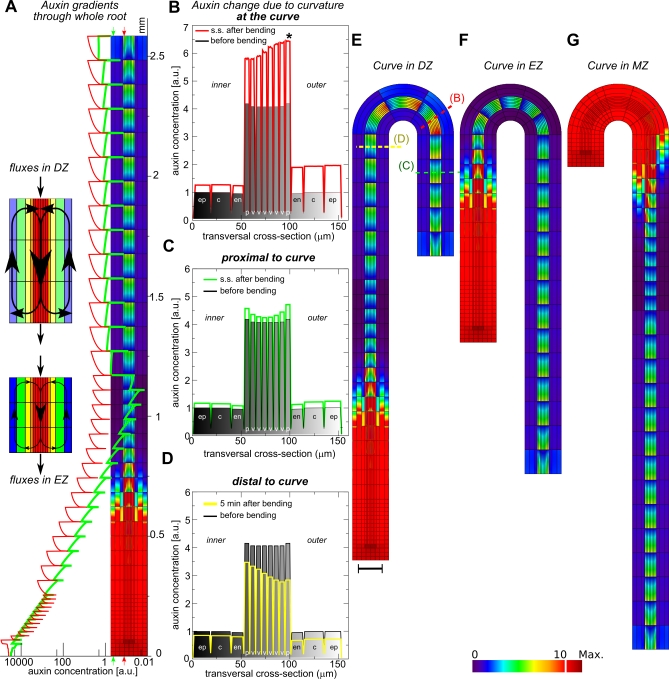
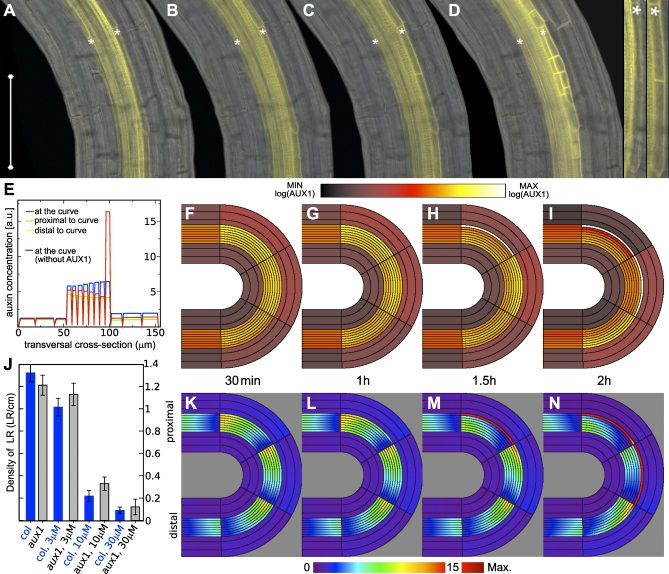
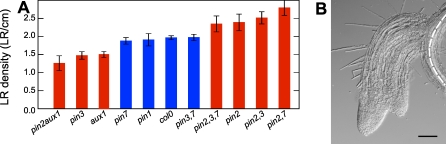
Lateral organ position along roots and shoots largely determines plant architecture, and depends on auxin distribution patterns. Determination of the underlying patterning mechanisms has hitherto been complicated because they operate during growth and division. Here, we show by experiments and computational modeling that curvature of the Arabidopsis root influences cell sizes, which, together with tissue properties that determine auxin transport, induces higher auxin levels in the pericycle cells on the outside of the curve. The abundance and position of the auxin transporters restricts this response to the zone competent for lateral root formation. The auxin import facilitator, AUX1, is up-regulated by auxin, resulting in additional local auxin import, thus creating a new auxin maximum that triggers organ formation. Longitudinal spacing of lateral roots is modulated by PIN proteins that promote auxin efflux, and pin2,3,7 triple mutants show impaired lateral inhibition. Thus, lateral root patterning combines a trigger, such as cell size difference due to bending, with a self-organizing system that mediates alterations in auxin transport.


Conflict of interest statement

Competing interests. The authors have declared that no competing interests exist.

Figures

Figure 1
Figure 1. Lateral Root Initiation Is Induced by Root Curvature
(A) Lateral roots are formed on the outside of curves in an alternating left/right rhythm (o indicates the outside, and i the inside of curve; L indicates left, and R right, relative to the main axis of the root). (B–D) Examples of root curvature resulting from gravitropic stimulation of different time intervals (B) 3 h; (C) 4.5 h; (D) never returned. Black asterisk (*) indicates the position of the emerged lateral root; red arrowhead indicates the center of curve. Scale bar represents 500 μm. (E) Lateral root formation correlates with the degree of root curvature resulting from gravitropic stimulation over various amounts of time. Symbols indicate time in the inverted position. Distance from the center of the curve to the nearest emerged lateral root is reported. (F) Lateral root initiation is induced in manually curved roots. Left: location along the curve where lateral roots form is reported alongside the comparable position(s) for straight roots. Center of curve is defined as zero, and negative values are closer to the root tip, distal to the center of the curve. The curve was made 0.5 cm from the root tip. Right: percentage of lateral roots forming on each side of the main root. Sides are defined as inside and outside for curved roots, and left and right for straight roots, as shown in Figure 1A. (G) DR5::GFP accumulates asymmetrically in the stele of manually curved roots. Solid red symbols indicate the outer half of the stele; open black symbols indicate the inner half. (H) Root curvature due to gravitropic response results in inverse asymmetric auxin distributions in the primary root MZ. DR5::vYFP (nuclear), PIN7:GFP (ER). Open arrowhead indicates the gravity vector during initial growth; the solid arrowhead indicates the gravity vector during the period of inversion; and the circled cross indicates the gravity vector directed into the plane during imaging. Scale bar represents 100 μm. (I–L) Auxin response is enhanced locally in the pericycle and adjacent endodermal cell at a curve prior to the asymmetric cell division. Fluorescent markers as in (H). (I) 300 min, (J) 110 min, and (K) 10 min before, and (L) 10 min after the pericycle cell division. Arrows mark the location of the dividing nucleus. Scale bar represents 100 μm.
Figure 2
Figure 2. Root and Model Layout
(A) Image of a live root, with meristem (MZ), elongation (EZ), and differentiation (DZ) zones indicated. (B–E) PIN expression domains of (B1–B3) PIN1:GFP, (C1–C3) PIN2:GFP, (D1–D3) PIN3:GFP, and (E1–E3) PIN7:GFP. For B1, C1, D1, and E1, the GFP is shown in green and the propidium iodide (PI) stain in red. In B2, C2, D2, and E2 (enlargements of the insets of the DZ, EZ, and MZ in overviews B1, C1, D1, and E1, respectively), the GFP is shown in red and PI channel in blue. In B3, C3, D3, and E3 (enlargements of the insets of the DZ, EZ, and MZ in overviews B1, C1, D1, and E1, respectively), the GFP channel is shown in white. Laser and microscope settings were constant for each marker line. Scale bars represent 100 μm in overviews and 50 μm in enlargements. (F) The in silico root describes the epidermis ([ep]; blue), cortex ([c]; green), endodermis ([en]; yellow), pericycle ([p]; orange), and vasculature ([v]; red). QC (grey) and columella cells (cyan) are only in the distal MZ. Scale bars represent 100 μm. Model cell types are endowed with specific PIN topologies and strengths, which vary by zone. Differences between zones are indicated by changes in color tone. Red indicates strong PIN expression, blue weak. Typical cell lengths vary between zones, as indicated. Cell widths vary between tissue types and are kept constant through the zones. Parameter values are given in Protocol S1: Tables S1–S3 and Text S1.
Figure 3
Figure 3. Auxin Gradients and Curvature Effects
(A) Steady-state auxin profile through the MZ, EZ, and DZ of a straight root. Longitudinal cross-sections through epidermal and pericycle files reported by green and red lines in graph; in silico root inlaid within the graph, along the y-axis indicating distance from root tip, and colors represent auxin concentration levels. Insets on left schematically show increased auxin-reflux loop in the DZ region when compared to a proximal MZ region. (B–D) Transversal auxin profile showing cross-sections through an unbent root (black and shaded) compared with those of a bent root (E), at different locations: at the curve (B), at steady state (s.s.), revealing strong outward concentrations bias; proximal to (above) the curve (C) at steady state (s.s.), showing minor alterations; distal to (below) the curve (D) 5 min after bending, revealing a transient auxin dip. The local auxin maximum that forms after bending is found in the outer pericycle cell (B) at the bend, indicated with an asterisk (*). (E) Steady-state auxin concentration profiles of a root bent in the DZ showing an outer bias. (F) Steady-state auxin concentration profiles in the EZ, demonstrating the failure of the bend to cause a relevant increase in auxin. (G) Steady-state auxin concentration profiles in the MZ, showing the inversion of the inner/outer bias. Piece-wise linear color bar represents absolute and relative auxin concentrations; scale bar represents 100 μm.
Figure 4
Figure 4. AUX1 Affects Lateral Root Initiation
(A–D) AUX1-YFP accumulates uniformly in the pericycle cells on the outside of the curve prior to lateral root initiation. (A) 230 min before, (B) 90 min before, (C) 10 min after, and (D) 520 min after the first asymmetric cell division. Insets from (A) and (C) show AUX1 levels in a single founder cell. Left shows a blowup of (A); right, a blowup of (C). White asterisks indicate the pericycle cell files. (E) Simulation showing the effect of a 4-fold increased influx in the two most apical pericycle cells of the outer bend, resulting in a local maximum, shown by comparing the transversal profile through an AUX1-expressing cell row (red) with cell rows proximal (green) and distal (yellow) to the bend. Default bias caused solely by curvature is shown in blue. (F–I and K–N) Simulation in which the whole tissue is endowed with the same sigmoidal auxin-dependent AUX1 response; (F–I) show the increase in magnitude of the AUX1 response after bending that eventually becomes focused to the outer pericycle cells, using a logarithmic color map from black (no AUX1 expression) to white (high AUX1 expression), as indicated in color bar; (K–N) show the resulting corresponding auxin concentration profiles, presenting a localization and amplification of the maximum. Heatmap for auxin concentrations indicated below; 30 min (F and K), 1 h (G and L), 1.5 h (H and M), and 2 h (I and N) after root bend. (J) 1-NOA inhibits lateral root formation, with wild-type plants being more sensitive than aux1 mutants. Density of emerged lateral roots was determined 4 d after roots were transferred to fresh media, for that region of the root that grew after transfer. Error bars represent the standard error of the mean (SEM).
Figure 5
Figure 5. PIN Proteins Affect Lateral Root Density and Spacing
(A) Density of emerged lateral roots (LR) was measured for plants grown on vertically oriented agar plates, 7 dpg. Red color indicates a statistically significant difference from Col-0 (p < 0.05 in a Student t-test). Error bars indicate SEM. (B) pin2,3,7 root showing fused lateral roots; white dotted line indicates the main root axis. Scale bar represents 100 μm.
Figure 6
Figure 6. PIN3/7 Modulate Longitudinal Positioning of Lateral Roots
(A–C) Depletion of PIN7:GFP in the stele is followed by primordium (LRP) initiation on the apical end of the depletion zone. Arrows indicate central portion of this zone. White asterisk indicates outer pericycle cell file. (D–F) Uniform PIN7:GFP expression correlates with initiation of multiple primordia around the bend. Red asterisk, placed just external to the pericycle cell file, indicates a cell that will undergo division. Nuclear localized DR5:vYFP indicates regions of auxin response. (A and D) 300 min, (B and E) 100 min, and (C and F) 0 min prior to cell division. (G) Segment of bent region in model; vascular cells with depolarized and weakened PIN expression are shown in pink. (H and I) Dynamics of flux field as a result of bending and fading PINs in distal cells. Flux directions are represented through angle dependent colors as indicated in the color-circle; flux magnitude is set through the color intensity, using a log-scale (from black, no flux, to bright color, maximum fluxes), i.e., the radial component of the color-circle.

Comment in

References

    1. Van Tieghem P, Duliot H. Recherches comparatives sur l'origine des membres endogènes dans les plantes vasculaires. Ann Sci Nat Bot. 1888;7:1–660.
    1. Parizot B, Laplaze L, Ricaud L, Boucheron-Dubuisson E, Bayle V, et al. Diarch symmetry of the vascular bundle in Arabidopsis root encompasses the pericycle and is reflected in distich lateral root initiation. Plant Physiol. 2008;146:140–148. - PMC - PubMed
    1. Dubrovsky JG, Gambetta GA, Hernandez-Barrera A, Shishkova S, Gonzalez I. Lateral root initiation in Arabidopsis: developmental window, spatial patterning, density and predictability. Ann Bot (Lond) 2006;97:903–915. - PMC - PubMed
    1. Fortin MC, Pierce FJ, Poff KL. The pattern of secondary root formation in curving roots of Arabidopsis thaliana (L.) Heynh. Plant Cell Environ. 1989;12:337–339. - PubMed
    1. De Smet I, Tetsumura T, De Rybel B, Frei dit Frey N, Laplaze L, et al. Auxin-dependent regulation of lateral root positioning in the basal meristem of Arabidopsis . Development. 2007;134:681–690. - PubMed

Publication types

MeSH terms