. 2008 Dec 16;6(12):e310.
doi: 10.1371/journal.pbio.0060310.

SUMO-specific protease 2 is essential for modulating p53-Mdm2 in development of trophoblast stem cell niches and lineages

Affiliations

SUMO-specific protease 2 is essential for modulating p53-Mdm2 in development of trophoblast stem cell niches and lineages

Shang-Yi Chiu et al. PLoS Biol. .

Abstract

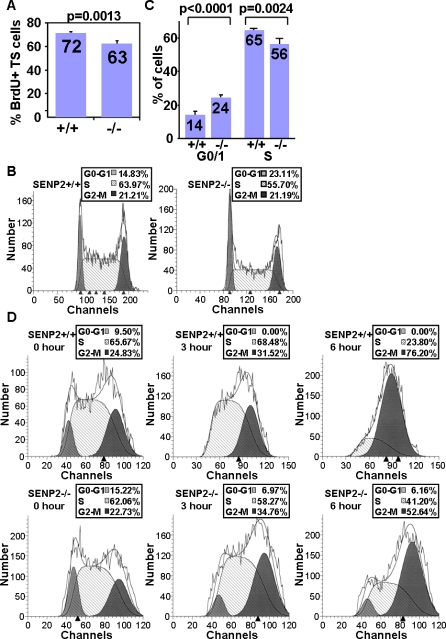
SUMO-specific protease 2 (SENP2) modifies proteins by removing SUMO from its substrates. Although SUMO-specific proteases are known to reverse sumoylation in many defined systems, their importance in mammalian development and pathogenesis remains largely elusive. Here we report that SENP2 is highly expressed in trophoblast cells that are required for placentation. Targeted disruption of SENP2 in mice reveals its essential role in development of all three trophoblast layers. The mutation causes a deficiency in cell cycle progression. SENP2 has a specific role in the G-S transition, which is required for mitotic and endoreduplication cell cycles in trophoblast proliferation and differentiation, respectively. SENP2 ablation disturbs the p53-Mdm2 pathway, affecting the expansion of trophoblast progenitors and their maturation. Reintroducing SENP2 into the mutants can reduce the sumoylation of Mdm2, diminish the p53 level and promote trophoblast development. Furthermore, downregulation of p53 alleviates the SENP2-null phenotypes and stimulation of p53 causes abnormalities in trophoblast proliferation and differentiation, resembling those of the SENP2 mutants. Our data reveal a key genetic pathway, SENP2-Mdm2-p53, underlying trophoblast lineage development, suggesting its pivotal role in cell cycle progression of mitosis and endoreduplication.


Conflict of interest statement

Competing interests. The authors have declared that no competing interests exist.

Figures

Figure 1
Figure 1. SENP2 Is Expressed in Trophoblast Lineage Development
(A and B) In situ hybridization reveals that SENP2 is expressed in the trophoblast stem cell niches, including extraembryonic ectoderm (exe) , chorion (Ch) and ectoplacental cone (epc) at E7.0 (A) and E7.5 (B). (C) RT-PCR analysis detected the SENP2 transcript in wild-type (+/+), but not knockout (–/–) TS cells. (D–O) Sections of the E8.5 (D–G), E9.5 (H–K) and E10.5 (L–O) placentas were analyzed by in situ hybridization for the expression of SENP2. Expression was detected in major extraembryonic tissues. Low magnification images display the overall expression pattern in developing placentas (D,H,L). High magnification images show expression in specific cell types and layers (E–G,I–K,M–O). The chorion, ectoplacental cone, labyrinth (L), spongiotrophoblast (S), and TGC (G; 1°, primary; 2°, secondary) layers are defined by orange, pink, blue, red, and green broken lines, respectively. Arrows indicate specific expression in mononuclear trophoblasts (cytotrophoblasts) of the labyrinth layer (M). Em, embryo. Scale bars, 1 mm (D,H,L); 100 μm (A,B,E–G,I–K,M–O).
Figure 2
Figure 2. Embryonic and Extraembryonic Abnormalities Caused by SENP2 Deficiency
(A–D) Whole mount analysis of the SENP2+/+ (A,C) and SENP2–/– (B,D) embryos identified growth restriction induced by the deletion of SENP2 at E9.5 (A,B) and E10.5 (C,D). (E–L) The placentas of SENP2+/+ (E,G,I,K) and SENP2–/– (F,H,J,L) were examined in whole mounts (E–H) or transverse sections (I–L) at E9.5 (E,F,I,J) and E10.5 (G,H,K,L). Labyrinth (L), spongiotrophoblast (S) and TGC (G) layers are defined by blue, red and green broken lines, respectively. Note that TGC layer is missing because of the very few cells present at E10.5 (L). (M–R) Sections of the E7.5–E8.5 extraembryonic tissues were analyzed by in situ hybridization of the ectoplacental cone (epc) marker Tpbpa (M,P) and immunostaining of the chorion (Ch) marker Cdx2 (N,O,Q,R), and counterstaining with nuclear fast red and hematoxylin, respectively. (S) The graph shows the average diameter of the control (+/+, +/–) and mutant (–/–) E10.5 placentas (p < 0.0001, n = 7). Scale bars, 1 mm (A–H); 500 μm (I–L); 300 μm (M,P); 50; μm (N,O,Q,R).
Figure 3
Figure 3. Developmental Defects of the SENP2-Null Labyrinth and Spongiotrophoblast Layers
Sections of E9.5–E11.5 placentas were analyzed by in situ hybridization of Gcm1 (A,B,D,E), Ctsq (C,F), or Tpbpa (M,N,P,Q) and counterstained with nuclear fast red (A–F,M,N,P,Q), by histology (G,J,O,R) and immunostaining of laminin (H,K) or cyclin D1 (I,L), and by counterstaining with hematoxylin (H,I,K,L). (A,D) The Gcm-1-positive trophoblast precursors localized to the invasion site were found in both the E9.5 SENP2+/+ and SENP2–/– placentas. (B,E) At E10, the SENP2 deletion caused an aberrant reduction in the Gcm-1 expressing cells. The Gcm-1-positive syncytiotrophoblasts failed to form an elongated multinuclear structure. (C,F) The Ctsq-positive cytotrophoblasts identified in the E11.5 wild-type labyrinth were missing in the mutant. (G,J) Arrows and arrowheads indicate maternal blood spaces surrounded by trophoblasts and fetal blood spaces surrounded by endothelia, respectively. (H,K) Laminin-labeled basement membrane, highlighting fetal blood spaces. (I,L) Cyclin D1 identified the proliferating endothelial cells. (M,N,P,Q) The number of the Tpbpa-expressing spongiotrophoblasts was drastically reduced by the loss of SENP2. (O,R) The thickness of the spongiotrophoblast layer, defined by broken red lines, decreased significantly. G, TGC; L, labyrinth; M, maternal decidua; S, spongiotrophoblast. Scale bars, 200 μm (A,D); 100 μm (B,C,E,F); 50 μm (G–L,O,R); 500 μm (M,N,P,Q).
Figure 4
Figure 4. Development of TGCs is Impaired in the SENP2 Mutants
(A–H) Histological analysis of the SENP2+/+ (A–D) and SENP2–/– (E–H) placentas revealed impaired development of both primary (1°G; A,B,E,F) and secondary (2°G; C,D,G,H) caused by SENP2 ablation at E8.5 (A,E), E9.5 (B,C,F,G) and E10.5 (D,H). (I–P,W–Z′) TGC development was examined by in situ hybridization analysis of specific markers PL-I (I–P) and Hand1 (W–Z and W′–Z′) at the stages shown (E7.5–E10.5). Stained (blue) sections were counterstained with nuclear fast red. In (I, M), enlargements of the left insets are shown on the right insets. (Q–V) Immunostaining of p450scc characterized the TGC in SENP2+/+ (Q–S) and SENP2–/– (T–V) at E8.5 (Q,T), and E9.5 (R,S,U,V). Immunostained (brown) sections were counterstained (blue) with hematoxylin. The TGC layers are defined by broken green lines (A–E,G,H,Q–Z,W′–Z′). AN, anterior neural fold; Em, embryo; G, TGC layer; M, maternal decidua; PS, primitive streak; S, spongiotrophoblast layer; Yc, yolk sac cavity. Scale bars, 500 μm (I–P); 100 μm (A,B,E,F,Q,R,T,U); 50 μm (C,D,G,H,S,V,W–Z,W′–Z′).
Figure 5
Figure 5. In Vitro Differentiation of SENP2-Null Blastocysts into Trophoblast Cells Is Defective
(A–H) Isolated SENP2+/+ (A) and SENP2–/– (B) blastocysts were cultured for trophoblast differentiation in vitro. Images were taken at culturing day 1 (A,B), day 3 (C,D) and day 6 (E–H). TS cells, outgrowing from the trophectoderm, differentiated into a single trophoblast cell (TC) layer, whereas the ICM formed aggregates and sat on top of the trophoblast cells (C,D). Arrows indicated TGCs present in the cultures (E,F). The cultures were then analyzed by immunostaining of a trophoblast specific marker p450scc (brown) and counterstaining of hematoxylin (blue) on day 6 (G,H). (I) The graph represents the average number of TGC present in the SENP2+/+ and SENP2–/– cultures (p = 0.005, n = 6). Scale bars, 200 μm (E–H); 100 μm (C,D); 50 μm (A,B).
Figure 6
Figure 6. Defects in Trophoblast Cell Cycle Progression Caused by SENP2 Deficiency
(A–H) In sections of the E7.5 and E8.5 SENP2+/+, SENP2+/– and SENP2–/– extraembryonic structures, Ki67 staining identified trophoblast progenitors undergoing cell cycle progression at the trophoblast stem cell niches (A,C,E,G). BrdU labeling for 1 h, performed on adjacent sections, detected the progression rate at S phase (B,D,F,H). (I–L) SENP2+/+ (I,J) and SENP2–/– (K,L) spongiotrophoblasts were analyzed by immunostaining of Ki67 at E10.5 (I,K) and E10 (J,L). Asterisks indicated the Ki67-negative cells in the SENP2+/+ spongiotrophoblast layer (I). The adjacent section of E10 placentas were stained with anti-BrdU to obtain the progression rate. (M) The graph represents cell cycle progression index, which is the average progression rate among actively cycling cells (% of BrdU divided by % of Ki67 × 102), at all stem cell niches, extraembryonic ectoderm, chorion and ectoplacental cone (p = 0.0001, n = 6). The positive and negative cells were counted to obtain the percentages of BrdU- and Ki67-positive cells. (N,O) The graphs represent the cell cycle progression index of the spongiotrophoblast (N; p = 0.0005, n = 3) and TGC (O; p = 0.0034, n = 4) layers. Ch, chorion; epc, ectoplacental cone; exe, extraembryonic ectoderm; G, TGC; M, maternal decidua; L, labyrinth; S, spongiotrophoblast. Scale bars, 50 μm (A–L).
Figure 7
Figure 7. SENP2 Is Critical for the G1–S Transition of Mitotic Division in TS Cells
(A) BrdU labeling for 1 h measured the proliferation rate of the SENP2+/+ and SENP2–/– TS cells in vitro. The graph shows the average percentages of the BrdU-positive cells in three independent experiments (p = 0.0013, n = 3). (B,C) Flow cytometric analysis of the PI-stained SENP2+/+ and SENP2–/– TS cells to determine their cell cycle profiles. The result shown in (B) is a representative of four independent experiments, and the graph in (C) shows the average percentage of the G0–G1 and S populations (n = 4). A consistent increase in the G0–G1 population (p < 0.0001) and decrease in the S population (p = 0.0024) was detected in the SENP2 mutants. (D) The SENP2+/+ and SENP2–/– TS cells were treated with nocodazole for 0, 3 and 6 h as indicated. Flow cytometric analyses showed that there was a delay in synchronizing the SENP2–/– cells upon the nocodazole treatment.
Figure 8
Figure 8. SENP2 Is Required for Trophoblast Maturation
(A–F) Immunostaining of the E8.5 (A,D), E9.5 (B,E) and E10.5 (C,F) SENP2+/+ (A–C) and SENP2–/– (D–F) placentas with lamin B, which marks nuclear envelopes, shows the size of nuclei. The TGC layers are defined by broken green lines. The stained (brown) sections were counterstained (blue) with hematoxylin. Note that the SENP2-null TGCs (D–F) contain smaller nuclei with less dotted staining (representing nucleoli and heterochromatin) than the controls (A–C). (G) Endoreduplication is impaired by the loss of SENP2. The SENP2+/+ and SENP2–/– TS cells were induced for differentiation into TGCs in vitro. Flow cytometric analysis of the differentiated SENP2+/+ and SENP2–/– cells, stained with PI, was used to measure their DNA contents (M1, two to four copies; M2, more than four copies). The diagram in (G) is a representative of five independent experiments; the average percentages of the SENP2+/+ and SENP2–/– polyploid cells in all five cultures is presented in (H) (p < 0.0001, n = 5). G,TGC layer; M, maternal decidua; S, spongiotrophoblast layer. Scale bars, 50 μm.
Figure 9
Figure 9. SENP2 Regulates the p53–Mdm2 Circuit During Trophoblast Development
(A–N) Sections of the E7.5 (M,N), E8.5 (A,D,G,J), E9.5 (B,E,H,K) and E10.5 (C,F,I,L) SENP2+/+ or SENP2+/– (A–C,G–I,M) and SENP2–/– (D–F,J–L,N) placentas were stained with an anti-p53 (A–F) or anti-Mdm2 antibody (G–N). The stained (brown) sections were counterstained with hematoxylin (blue). (D–F) Nuclear accumulations of p53 (arrows) were detected in the SENP2 mutants. (G–I) In the SENP2+/+ TGCs, Mdm2 predominantly accumulated in the cytoplasm at E8.5 and E9.5 (arrowheads; G,H), but in the nucleus at E10.5 (arrows; I). (J–L) Nuclear accumulations of Mdm2 were found throughout the SENP2–/– TGC development at E8.5–E10.5 (arrows; J,K,L). The TGC layers are defined by broken green lines. (M,N) Mdm2 showed clear nuclear localizations in the SENP2–/– trophoblast progenitors at the niche sites (N), whereas it was evenly distributed in the controls (M). Enlargements of the insets are shown. (O) SUMO modification of Mdm2 is regulated by SENP2. Immunoblot analysis with anti-Mdm2 and anti-SUMO-1 antibodies shows that Mdm2 accumulated in its sumoylated state (Mdm2–SUMO) in the SENP2–/– trophoblast cells. Two different cell lines (#1 and #2) were examined. The Mdm2–SUMO band could also be detected by immunoprecipitation–immunoblot with anti-Mdm2 and anti-SUMO-1 antibodies (data not shown). Reintroduction of SENP2 into the SENP2–/– TS cells diminished the Mdm2–SUMO level. Actin level also was analyzed as a loading control. The number indicates the ratio of Mdm2–SUMO and Mdm2. (P) The p53 protein level is regulated by SENP2. Protein lysates were isolated from the SENP2+/+ and SENP2–/– TS cells with or without transfection of MT–SENP2. Immunoblot analysis with an anti-p53 antibody revealed the steady state levels of p53 and actin (loading control). Inactivation of SENP2 induced an accumulation of p53 in trophoblasts. Reintroduction of SENP2 down regulated p53 in the SENP2-null mutants. The number represents the expression level of p53 in SENP2–/– relative to that in SENP2+/+. (Q) SENP2 is necessary and sufficient to induce trophoblast differentiation. Protein lysates were isolated from the SENP2+/+ and SENP2–/– placentas at E10.5, and the SENP2+/+ and SENP2–/– TS cells with or without transfection of MT–SENP2. The TS cells were cultured in differentiation media for 6 d to obtain the differentiated TGCs. Immunoblot analysis with an antibody that recognizes either p450scc or MT revealed the steady state protein level. The levels of ER protein calnexin and actin were analyzed as loading controls. The number shows the quantitative difference in p450scc expression. (R) Preferential accumulations of Mdm2 (arrow) and Mdm2–SUMO (arrowheads) in TS cells. Nuclear (N) and cytoplasmic (C) extracts of SENP2–/– were analyzed by immunoblot with anti-Mdm2 and anti-SUMO-1 antibodies. Asterisk indicates non specific reaction detected after cell fractionation. (S–X) Mdm2 and Mdm2–SUMO are differentially localized in the cell. TS cells transfected by the GFP-tagged Mdm2 (S,T,V) or Mdm2–SUMO-1 fusion (U,W,X) under control of a CMV promoter were analyzed by GFP analysis with either phase contrast (S–U) or by immunofluorescence microscopy (blue, DAPI) (V–X). G, TGC layer; M, maternal decidua; S, spongiotrophoblast layer; Yc, yolk sac cavity. Scale bars, 50 μm (A–N,S–U); 20 μm (V–X).
Figure 10
Figure 10. Repression of p53 Is Necessary and Sufficient to Promote Trophoblast Proliferation and Differentiation
(A,B) Nutlin-3 stimulates p53 in a dosage-dependent manner (A) and accumulation of p53 in the SENP2-nulls can be knocked down by RNAi (B). Protein lysates, isolated from SENP2+/+ and SENP2–/– TS cells treated with Nutlin-3 (A) or transfected by p53 RNAi (B), were analyzed for the p53 expression by immunoblot. Calnexin was used as a loading control. (C) Activation of p53 by Nutlin-3 caused a delay in the G1–S transition. Flow cytometric analysis of PI-stained SENP2+/+ TS cells determined the cell cycle profiles without Nutlin-3 or affected by Nutlin-3 treatment for 24 or 48 h. The Nutlin-3 (8 μM) treatment induced a cell cycle arrest at G1–S. (D) The p53 RNAi treatment alleviates the cell cycle defects caused by the SENP2 deletion. The SENP2–/– TS cells with or without p53 RNAi (100 nM) were treated with nocodazole for 30 h. Flow cytometric analyses revealed that the cell population arrested in G0–G1 of SENP2–/– TS cells was reduced by the p53 knockdown. (C,D) are representatives of two independent experiments. (E) Stimulation of p53 is necessary and sufficient to inhibit trophoblast maturation. Protein lysates, isolated from SENP2+/+ and SENP2–/– cells with or without the Nutlin-3 (8 μM) treatment and the transfection of p53 RNAi, were analyzed by immunoblot analysis for the expression of a TGC marker p450scc. Calnexin was used as a loading control. (F–K) Nutlin-3 inhibits differentiation of blastocysts into TGCs. Isolated blastocysts were cultured for trophoblast differentiation in the absence (F–H) and presence (I–K) of Nutlin-3 (8 μM) in vitro. Images were taken at culturing day 1 (F,I), day 3 (G,J) and day 6 (H,K). The cultures were then analyzed by immunostaining of a TGC-specific marker p450scc (brown) and counterstaining by hematoxylin (blue) on day 6 (H,K). Asterisks indicate TGCs. (L) The graph shows the average number of TGC present in the cultures (p = 0.006, n = 4). Scale bars, 100 μm (F–K).
Figure 11
Figure 11. Model for the SENP2–Mdm2–p53 Pathway in Trophoblast Development
(A) Diagram illustrating the p53–Mdm2 circuit regulated by SENP2 in the trophoblast cell cycle. Stimulation of Mdm2 by SENP2 leads to degradation of p53. Cellular levels of p53 control the G–S transition that has a dual role in TGC development. The G–S phase is required for both mitotic division (cell cycle: G1, S, G2, and M) and endoreduplication (endocycle: G and S only) during expansion of trophoblast stem cells and maturation of trophoblasts, respectively. Although a low p53 level is essential for stem cell proliferation, inhibition of p53 is required upon differentiation. (B) Schematic representation for the mechanism underlying the regulation of p53 and Mdm2 by the SUMO pathway. SENP2 activates Mdm2 by removing SUMO that permits the modulation of p53 by Mdm2 in the nucleus. The ubiquitin-conjugated p53 is then degraded in the cytoplasm.

Comment in

  • Lessons on life from SENP2.
    Sedwick C. Sedwick C. PLoS Biol. 2008 Dec;6(12):e312. doi: 10.1371/journal.pbio.0060312. Epub 2008 Dec 16. PLoS Biol. 2008. PMID: 20076701 Free PMC article. No abstract available.

References

    1. Rossant J, Cross JC. Placental development: lessons from mouse mutants. Nat Rev Genet. 2001;2:538–548. - PubMed
    1. Red-Horse K, Zhou Y, Genbacev O, Prakobphol A, Foulk R, et al. Trophoblast differentiation during embryo implantation and formation of the maternal-fetal interface. J Clin Invest. 2004;114:744–754. - PMC - PubMed
    1. Simmons DG, Cross JC. Determinants of trophoblast lineage and cell subtype specification in the mouse placenta. Dev Biol. 2005;284:12–24. - PubMed
    1. Armant DR. Blastocysts don't go it alone. Extrinsic signals fine-tune the intrinsic developmental program of trophoblast cells. Dev Biol. 2005;280:260–280. - PMC - PubMed
    1. Sutherland A. Mechanisms of implantation in the mouse: differentiation and functional importance of trophoblast giant cell behavior. Dev Biol. 2003;258:241–251. - PubMed

Publication types

MeSH terms