. 2009 Mar;296(3):F614-21.
doi: 10.1152/ajprenal.90500.2008. Epub 2008 Dec 17.

C-peptide reverses TGF-beta1-induced changes in renal proximal tubular cells: implications for treatment of diabetic nephropathy

Affiliations

C-peptide reverses TGF-beta1-induced changes in renal proximal tubular cells: implications for treatment of diabetic nephropathy

Claire E Hills et al. Am J Physiol Renal Physiol. 2009 Mar.

Abstract

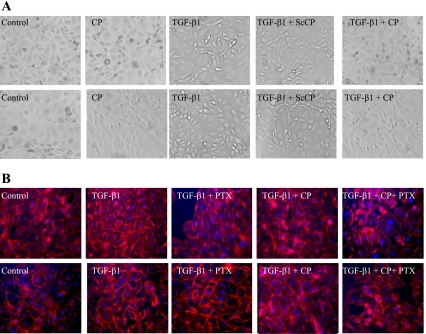
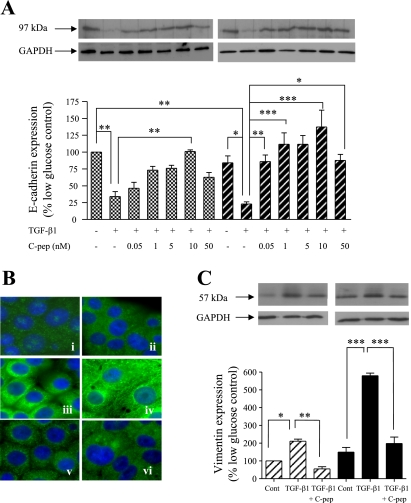
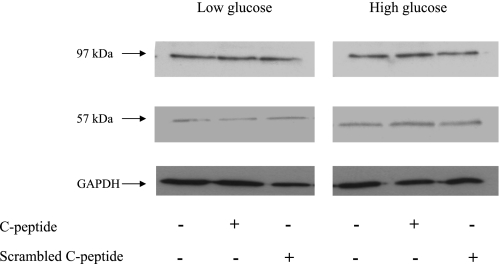
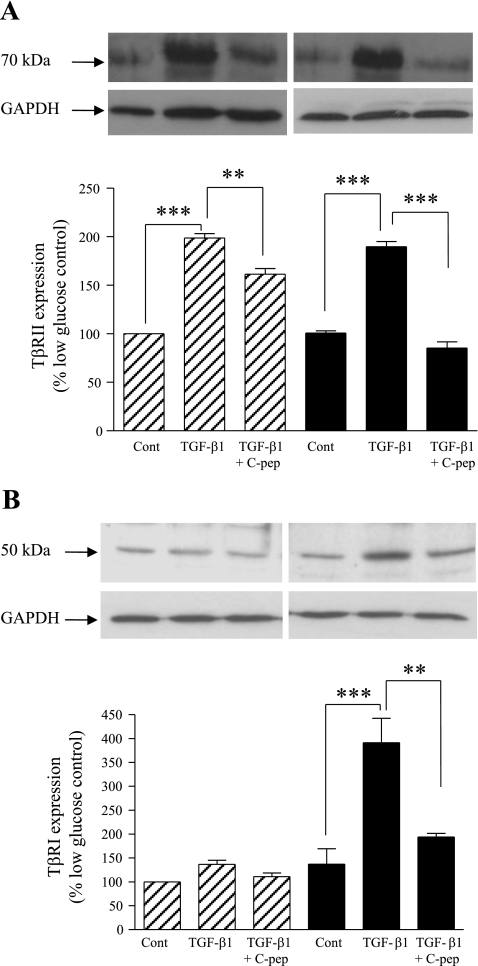
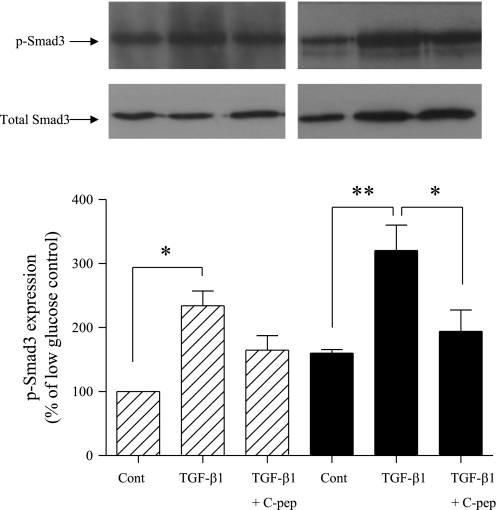
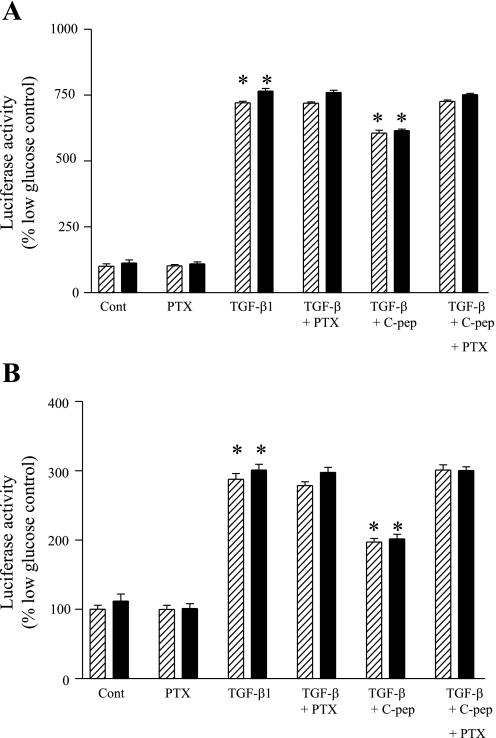
The crucial pathology underlying progressive chronic kidney disease in diabetes is tubulointerstitial fibrosis. Central to this process is epithelial-mesenchymal transformation (EMT) of proximal tubular epithelial cells driven by maladaptive transforming growth factor-beta1 (TGF-beta1) signaling. Novel signaling roles for C-peptide have recently been discovered with evidence emerging that C-peptide may mitigate microvascular complications of diabetes. We studied the potential for C-peptide to interrupt injurious TGF-beta1 signaling pathways and thus block development of EMT in HK2 human kidney proximal tubular cells. Cells were incubated with TGF-beta1 either alone or with C-peptide in low or high glucose. Changes in cell morphology, TGF-beta1 receptor expression, vimentin, E-cadherin, and phosphorylated Smads were assessed. Luciferase reporters were used to assess Smad activity. The cytoskeleton was visualized by TRITC-phalloidin staining. The typical TGF-beta1-stimulated, EMT-associated morphological alterations of proximal tubular cells, including increased vimentin expression, decreased E-cadherin expression, and cytoskeletal rearrangements, were prevented by C-peptide treatment. C-peptide also blocked TGF-beta1-induced upregulation of expression of both type I and type II TGF-beta1 receptors and attenuated TGF-beta1-mediated Smad phosphorylation and Smad transcriptional activity. These effects of C-peptide were inhibited by pertussis toxin. The results demonstrate that C-peptide almost completely reversed the morphological changes in PT cells induced by TGF-beta1 and suggest a role or C-peptide as a renoprotective agent in diabetic nephropathy.


Figures

Fig. 1.
Fig. 1.
C-peptide reverses transforming growth factor (TGF)-β1-induced morphological and cytoskeletal changes in HK-2 cells. For assessment of HK-2 morphology, cells were examined by phase-contrast microscopy. HK-2 cells were grown under low-glucose conditions or high-glucose conditions. Cells were either unstimulated or stimulated with 5 nm C-peptide (CP) alone, 2 ng/nl TGF-β1 alone, or cotreated with 2 ng/ml TGF-β1 and 5 nM scrambled C-peptide (ScCP), or 2 ng/ml TGF-β1 and 5 nM CP (A). For assessment of the cytoskeleton, cells were stained with TRITC-phalloidin, counterstained with DAPI, and examined by immunofluorescence microscopy (B). Cells were either unstimulated or stimulated with 2 ng/nl TGF-β1 alone or cotreated with 2 ng/ml TGF-β1 and Pertussis toxin (PTX), 2 ng/ml TGF-β1 and 5 nM CP or 2 ng/ml TGF-β1, 5 nM C-peptide, and PTX. Images representative of ≥3 individual experiments are shown (magnification ×20).
Fig. 2.
Fig. 2.
C-peptide reverses TGF-β1-induced changes in E-cadherin and vimentin expression. A: HK-2 cells were grown in low or high glucose alone, or together either with 2 ng/ml TGF-β1 alone or 2 ng/ml TGF-β1 and the indicated concentrations of C-peptide (C-pep), and cell levels of E-cadherin were determined by immunoblotting. Top: representative immunoblots [low glucose (left), high glucose (right)] showing E-cadherin expression (top blots) or the same blots stripped and reprobed for GAPDH as a loading control (bottom blots). Blots were quantified by densitometry, and the nonstimulated low-glucose control condition was normalized to 100% and all other conditions were compared with this. Bottom: results of densitometry of ≥3 blots. Each bar in the histogram represents the same condition in the blots above. Cross-hatched bars, low glucose; hatched bars, high glucose. *P < 0.05, **P < 0.01, ***P < 0.001. B: vimentin localization and expression were studied. HK-2 cells were cultured in low glucose (i, iii, v) or high glucose (ii, iv, vi) and immunostained for vimentin and visualized by fluorescent microscopy. In some experiments, cells were treated with 2 ng/ml TGF-β1 alone (iii, iv) or 2 ng/ml TGF-β1 and 5 nM C-peptide (v, vi). Images representative of ≥3 individual experiments are shown (magnification ×40). C: vimentin expression by immunoblotting. HK-2 cells were grown in low or high glucose alone, or together with either 2 ng/ml TGFβ-1 alone or 2 ng/ml TGFβ-1 and 5 nM C-peptide, and cell levels of vimentin were determined by immunoblotting. Top: representative immunoblots [low glucose (left), high glucose (right)] showing vimentin expression (top blots) or the same blots stripped and reprobed for GAPDH as a loading control (bottom blots). Blots were quantified by densitometry, and the nonstimulated low-glucose control condition was normalized to 100% and all other conditions were compared with this. Bottom: results of densitometry of ≥3 blots. Each bar in the histogram represents the same condition in the blots above. Hatched bars, low glucose; filled bars, high glucose. *P < 0.05, **P < 0.01, ***P < 0.001.
Fig. 3.
Fig. 3.
No effect of C-peptide or ScC-peptide alone on expression of E-cadherin or vimentin. HK-2 cells were grown in low or high glucose alone, or together with either 5 nM C-peptide or scrambled C-peptide for 48 h, and immunoblotting was used to determine the effects on E-cadherin and vimentin expression [low glucose (left), high glucose (right)]. The same blots were stripped and reprobed for GAPDH as a loading control.
Fig. 4.
Fig. 4.
C-peptide inhibits TGF-β1-induced TGF-β1 type II receptor (TβRII) and type I receptor (TβRI) expression. A: TβRII expression by immunoblotting. HK-2 cells were grown in low or high glucose alone, or together with either 2 ng/ml TGF-β1 alone or 2 ng/ml TGF-β1 and 5 nM C-peptide, and cell levels of TβRII were determined by immunoblotting. Top: representative immunoblots [low glucose (left), high glucose (right)] showing TβRII expression (top blots) or the same blots stripped and reprobed for GAPDH as a loading control (bottom blots). Blots were quantified by densitometry, and the nonstimulated low-glucose control condition was normalized to 100% and all other conditions were compared with this. Bottom: results of densitometry of ≥3 blots. Each bar in the histogram represents the same condition in the blots above. Hatched bars, low glucose; filled bars, high glucose. **P < 0.01, ***P < 0.001. B: TβRI expression by immunoblotting. HK-2 cells were grown in low or high glucose alone, or together with either 2 ng/ml TGF-β1 alone or 2 ng/ml TGF-β1 and 5 nM C-peptide, and cell levels of TβRI were determined by immunoblotting. Top: representative immunoblots [low glucose (left), high glucose (right)] showing TβRI expression (top blots) or the same blots stripped and reprobed for GAPDH as a loading control (bottom blots). Blots were quantified by densitometry, and the nonstimulated low-glucose control condition was normalized to 100% and all other conditions were compared with this. Bottom: results of densitometry of ≥3 blots. Each bar in the histogram represents the same condition in the blots above. Hatched bars, low glucose; filled bars, high glucose. **P < 0.01, ***P < 0.001.
Fig. 5.
Fig. 5.
C-peptide attenuates TGF-β1-activated Smad3 phosphorylation. Total Smad3 and pSmad3 expression were determined by immunoblotting in HK-2 cells grown in low or high glucose alone, or together with either 2 ng/ml TGFβ-1 alone or 2 ng/ml TGFβ-1 and 5 nM C-peptide. Top: representative immunoblots [low glucose (left), high glucose (right)] showing pSmad3 expression (top blots) or the same blots stripped and reprobed for total Smad3 as a loading control (bottom blots). Blots were quantified by densitometry, and the nonstimulated low-glucose control condition was normalized to 100% and all other conditions were compared with this. Bottom: results of densitometry of ≥3 blots. Each bar in the histogram represents the same condition in the blots above. Hatched bars, low glucose; filled bars, high glucose. **P < 0.01, *P < 0.05.
Fig. 6.
Fig. 6.
Attenuation of TGF-β1-mediated phosphorylation of Smad3 and Smad2 by C-peptide. A: HK-2 cells transiently transfected with GAGA-luc and pSV-βgal for Smad3 were either untreated (control) or treated for 48 h with TGF-β1 or a combination of TGF-β1 and C-peptide in low (hatched bars) or high glucose (filled bars). Cells were lysed, and luciferase activity in lysates was determined and normalized for transfection efficiency using β-galactidose activity. Normalized luciferase activity is expressed as a percentage compared with control (nonstimulated) cells. Values are means ± SE; n = 4 experiments. *P < 0.05. B: HK-2 cells transiently transfected with ARE-luc, MF1, and pSV-βgal for Smad2 were either untreated (control) or treated for 48 h with TGF-β1 or a combination of TGF-β1 and C-peptide in low (hatched bars) or high (filled bars) glucose. Cells were lysed, and luciferase activity in lysates was determined and normalized for transfection efficiency using β-galactidose activity. Normalized luciferase activity is expressed as a percentage compared with control in nonstimulated cells. Values are means ± SE; n = 4 experiments. *P < 0.05.

References

    1. Al-Rasheed NM, Meakin F, Royal EL, Lewington AJ, Brown J, Willars GB, Brunskill NJ. Potent activation of multiple signalling pathways by C peptide in opossum kidney proximal tubular cells. Diabetologia 47: 987–997, 2004. - PubMed
    1. Al-Rasheed NM, Chana RS, Baines RJ, Willars GB, Brunskill NJ. Ligand-independent activation of peroxisome proliferator-activated receptor-gamma by insulin and C-peptide in kidney proximal tubular cells: dependent on phosphatidylinositol 3-kinase activity. J Biol Chem 279: 49747–49754, 2004. - PubMed
    1. Bakin AV, Tomlinson AK, Bhowmick NA, Moses HL, Arteaga CL. Phosphatidylinositol 3-kinase function is required for transforming growth factor beta-mediated epithelial to mesenchymal transition and cell migration. J Biol Chem 275: 36803–36810, 2000. - PubMed
    1. Bland R, Walker EA, Hughes SV, Stewart PM, Hewison M. Constitutive expression of 25-hydroxyvitamin D3–1α-hydroxylase in a transformed human proximal tubule cell line: evidence for direct regulation of vitamin D metabolism by calcium. Endocrinology 140: 2027–2034, 1999. - PubMed
    1. Burns WC, Twigg SM, Forbes JM, Pete J, Tikellis C, Thallas-Bonke V, Thomas MC, Cooper ME, Kantharidis P. Connective tissue growth factor plays an important role in advanced glycation end product-induced tubular epithelial-to-mesenchymal transition: implications for diabetic renal disease. J Am Soc Nephrol 7: 2484–2494, 2006. - PubMed

Publication types