. 2009 Mar;83(5):2119-29.
doi: 10.1128/JVI.02113-08. Epub 2008 Dec 17.

Structural characterization of the Rous sarcoma virus RNA stability element

Affiliations

Structural characterization of the Rous sarcoma virus RNA stability element

Jason E Weil et al. J Virol. 2009 Mar.

Abstract

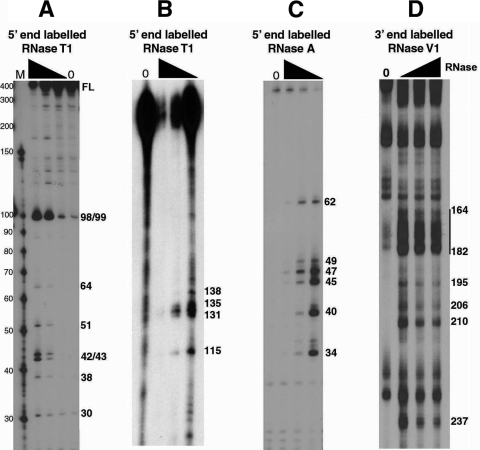
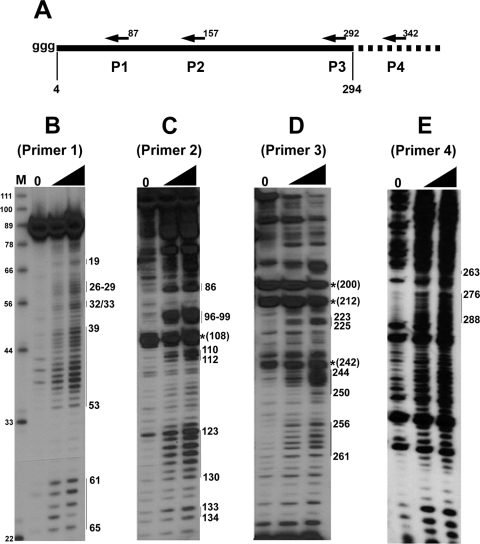
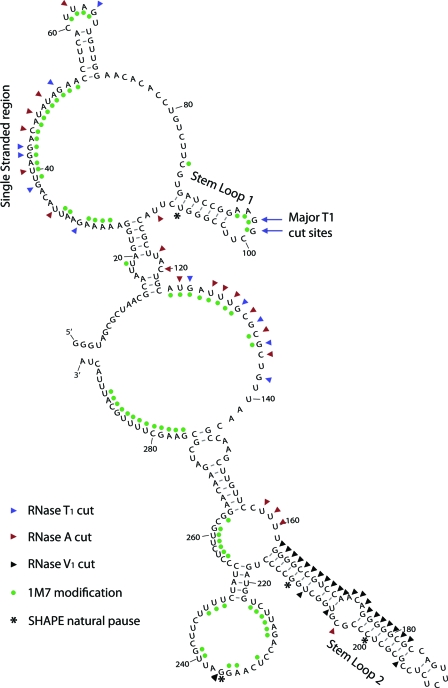
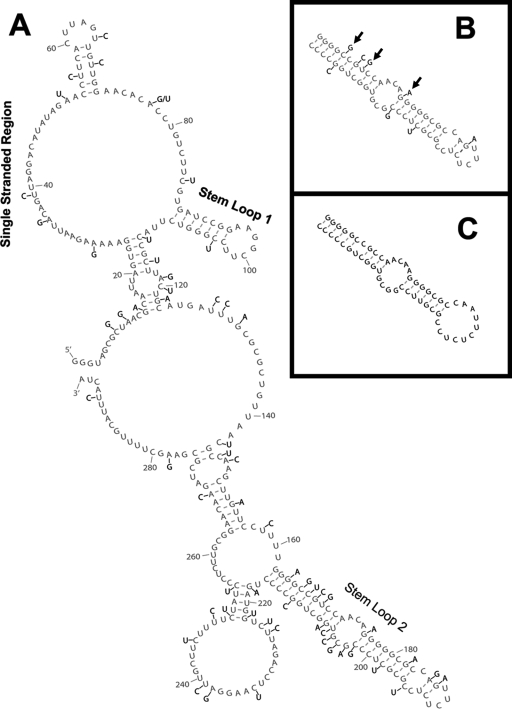
In eukaryotic cells, an mRNA bearing a premature termination codon (PTC) or an abnormally long 3' untranslated region (UTR) is often degraded by the nonsense-mediated mRNA decay (NMD) pathway. Despite the presence of a 5- to 7-kb 3' UTR, unspliced retroviral RNA escapes this degradation. We previously identified the Rous sarcoma virus (RSV) stability element (RSE), an RNA element downstream of the gag natural translation termination codon that prevents degradation of the unspliced viral RNA. Insertion of this element downstream of a PTC in the RSV gag gene also inhibits NMD. Using partial RNase digestion and selective 2'-hydroxyl acylation analyzed by primer extension (SHAPE) chemistry, we determined the secondary structure of this element. Incorporating RNase and SHAPE data into structural prediction programs definitively shows that the RSE contains an AU-rich stretch of about 30 single-stranded nucleotides near the 5' end and two substantial stem-loop structures. The overall secondary structure of the RSE appears to be conserved among 20 different avian retroviruses. The structural aspects of this element will serve as a tool in the future design of cis mutants in addressing the mechanism of stabilization.


Figures

FIG. 1.
FIG. 1.
Partial RNase digestion shows single- and double-stranded regions of RSE RNA. (A and B) The 5′-end-labeled RSE RNA (294 nt) was digested with increasing amounts of RNase T1. The resulting cleavage products were run on a 15% (A) or 8% (B) polyacrylamide-8 M urea gel. Note that in panel A the 294-nt RSE full-length (FL) RNA comigrates with a marker of approximately 400 nt. (C) The 5′-end-labeled RSE RNA was digested with increasing amounts of RNase A and resolved on an 8 M urea-15% polyacrylamide gel. (D) The 3′-end-labeled RSE RNA was digested with RNase V1 and resolved on an 8 M urea-8% polyacrylamide gel. Numbers on the right correspond to the RSE nucleotide that is cleaved by RNase. Nucleotide position 4 of the RSE RNA corresponds to nt 2597 of the complete RSV genomic RNA sequence. The black triangle indicates increasing RNase concentrations. Lanes 0, RNA alone (no RNase added).
FIG. 2.
FIG. 2.
SHAPE chemistry reveals structural features of the RSE. (A) A schematic of the in vitro transcribed RSE RNA used in structural studies. Nucleotide position 4 of the RSE RNA corresponds to nt 2597 of RSV. Folded, in vitro transcribed RSE RNA was selectively modified at single-stranded nucleotides by the compound 1M7. Modified nucleotides were detected by primer extension using primers (P) beginning at nt 87 (B), 157 (C), 292 (D), and 342 (E). Extension products were resolved on 12% or 15% polyacrylamide-8 M urea gels. The numbers on the right correspond to the modified RSE nucleotide. *, a nucleotide at which there is a natural pause site or break in the RNA. The RNA used for primer extension in panel E is approximately 100 nt longer at both the 5′ and 3′ ends. The black triangle indicates increasing 1M7 amounts. Lanes 0, RNA alone (no 1M7 added).
FIG. 3.
FIG. 3.
Secondary structure model of the RSE RNA. RSE RNA corresponding to nt 2597 to 2885 (nt 4 to 292 in this figure) was folded in silico using the Mfold RNA structure prediction program (41). The RNase T1 and A cuts as well as SHAPE modifications (1M7) shown in Fig. 1 and 2 were used as constraints for this prediction and are indicated on the structure. Natural pause sites and RNase V1 were not included in the prediction but are indicated on this figure.
FIG. 4.
FIG. 4.
Analysis of 20 retroviral genomes shows variant nucleotide positions within the RSE. Genomic sequences of 20 different avian retroviral strains were aligned, and variant nucleotide positions were noted. (A) A nucleotide position that varied in one or more of the 20 retroviral strains is indicated (black lettering) on the two-dimensional model from Fig. 3 (gray lettering). The three key structural features are indicated. (B) The RSE stem-loop 2 region is shown in gray, with variant nucleotides from the most divergent strain (ALV NX0101) shown in black. Arrows indicate a compensatory mutation, a new base pair, and a coordinated disruption of a base pair. (C) Mfold prediction of the stem-loop 2 region from ALV NX0101.
FIG. 5.
FIG. 5.
Analytical ultracentrifugation of the RSE RNA. (A) Sedimentation equilibrium data were collected at three rotor speeds (9,000, 10,500, and 12,000 rpm) at 20°C with a loading concentration of 20 μg/ml monitored at 260 nm. Data plots were offset by 0.2 absorbance units (AU) for clarity. The solid line represents the predicted mobility of an RNA with a molecular mass of 94,173 Da (the mass calculated from the RSE RNA sequence) as determined by the Ultrascan software. (B) Comparison of curve fits to the 12,000-rpm data set from panel A. Using the Ultrascan software, the molecular mass was constrained to either the monomeric (solid line; 94,173 Da) or dimeric (dashed line; 188,346 Da) calculated mass, and both of these predicted curves were overlaid on the graph. (C) Van Holde-Weischet analysis of the velocity sedimentation data at 35,000 rpm and 20°C shows that the sample is primarily a single species. This plot was constructed by analyzing 50 equally spaced boundary fractions, spanning 10 to 90% of the boundary. The average S value determined was 7.4. (Inset) The same data analyzed using the time derivative method produced the same S value. MW, molecular weight; Sed Coeff, sedimentation coefficient.

References

    1. Amrani, N., R. Ganesan, S. Kervestin, D. A. Mangus, S. Ghosh, and A. Jacobson. 2004. A faux 3′-UTR promotes aberrant termination and triggers nonsense-mediated mRNA decay. Nature 432112-118. - PubMed
    1. Barker, G. F., and K. Beemon. 1991. Nonsense codons within the Rous sarcoma virus gag gene decrease the stability of unspliced viral RNA. Mol. Cell. Biol. 112760-2768. - PMC - PubMed
    1. Barker, G. F., and K. Beemon. 1994. Rous sarcoma virus RNA stability requires an open reading frame in the gag gene and sequences downstream of the gag-pol junction. Mol. Cell. Biol. 141986-1996. - PMC - PubMed
    1. Barreau, C., L. Paillard, and H. B. Osbourne. 2005. AU-rich elements and associated factors: are there unifying principles? Nucleic Acids Res. 337138-7150. - PMC - PubMed
    1. Beemon, K. L. 2008. Retroviruses of birds, p. 455-459. In B. W. J. Mahy and M. H. V. Van Regenmortel (ed.), Encyclopedia of virology. Elsevier, Oxford, United Kingdom.

Publication types

LinkOut - more resources