

Complementary but distinct roles for MRI and 18F-fluoromisonidazole PET in the assessment of human glioblastomas
- PMID: 19091885
- PMCID: PMC4154624
- DOI: 10.2967/jnumed.108.055467
Complementary but distinct roles for MRI and 18F-fluoromisonidazole PET in the assessment of human glioblastomas
Abstract
Glioblastoma multiforme is a primary brain tumor known for its rapid proliferation, diffuse invasion, and prominent neovasculature and necrosis. This study explores the in vivo link between these characteristics and hypoxia by comparing the relative spatial geometry of developing vasculature inferred from gadolinium-enhanced T1-weighted MRI (T1Gd), edematous tumor extent revealed on T2-weighted MRI (T2), and hypoxia assessed by 18F-fluoromisonidazole PET (18F-FMISO). Given the role of hypoxia in upregulating angiogenic factors, we hypothesized that the distribution of hypoxia seen on 18F-FMISO is correlated spatially and quantitatively with the amount of leaky neovasculature seen on T1Gd.
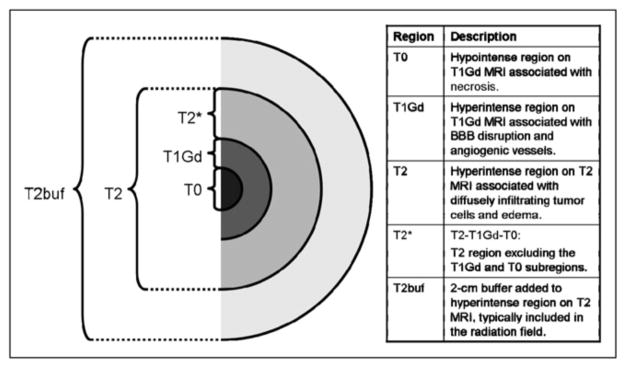
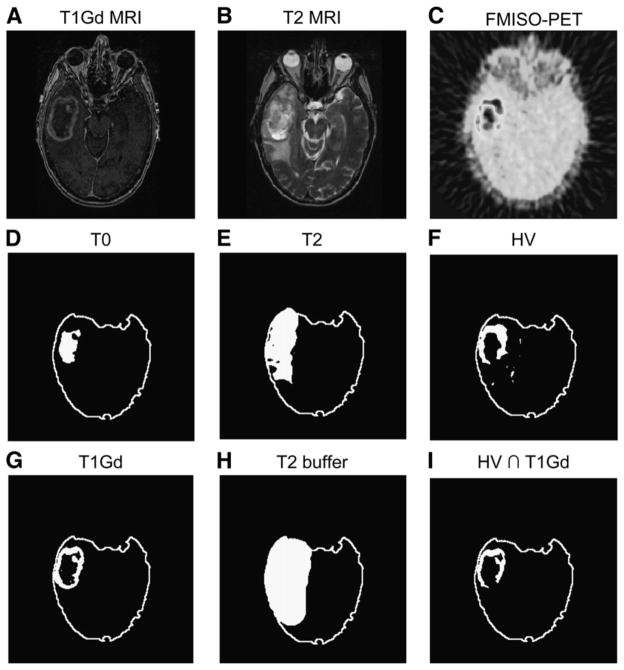
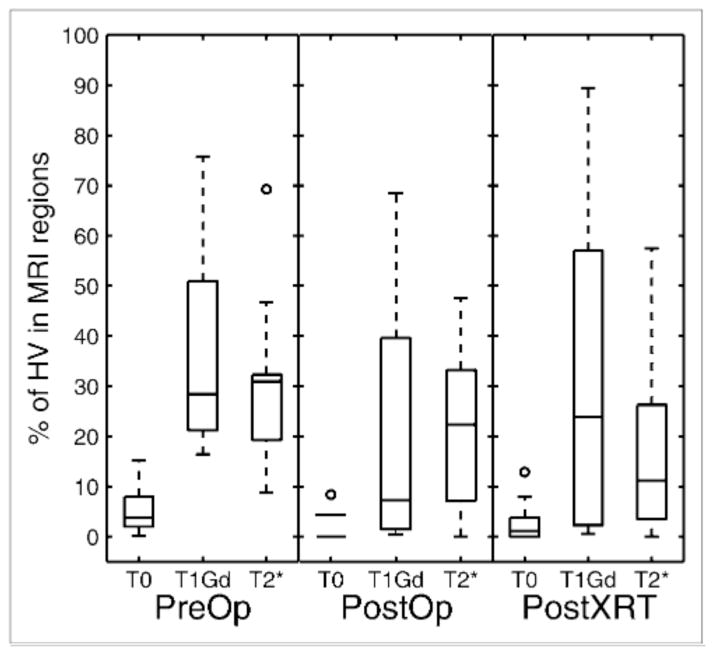
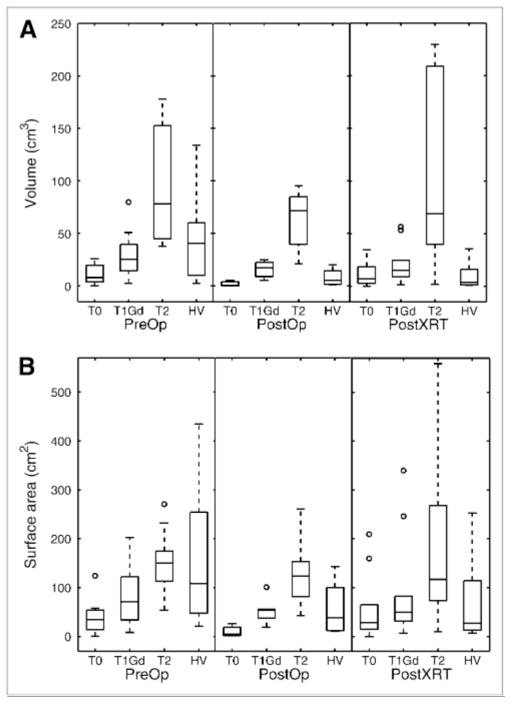
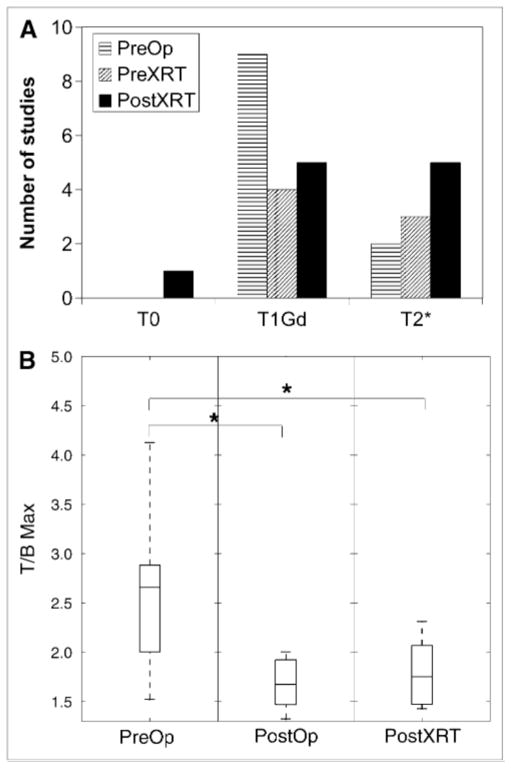
Methods: A total of 24 patients with glioblastoma underwent T1Gd, T2, and 18F-FMISO-11 studies preceded surgical resection or biopsy, 7 followed surgery and preceded radiation therapy, and 11 followed radiation therapy. Abnormal regions seen on the MRI scan were segmented, including the necrotic center (T0), the region of abnormal blood-brain barrier associated with disrupted vasculature (T1Gd), and infiltrating tumor cells and edema (T2). The 18F-FMISO images were scaled to the blood 18F-FMISO activity to create tumor-to-blood ratio (T/B) images. The hypoxic volume (HV) was defined as the region with T/Bs greater than 1.2, and the maximum T/B (T/Bmax) was determined by the voxel with the greatest T/B value.
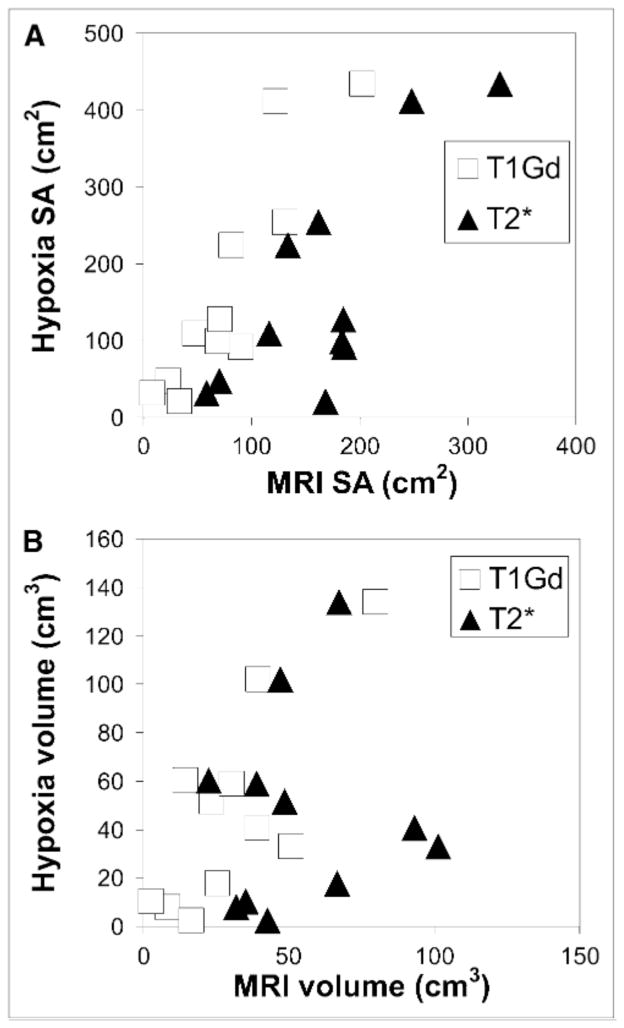
Results: The HV generally occupied a region straddling the outer edge of the T1Gd abnormality and into the T2. A significant correlation between HV and the volume of the T1Gd abnormality that relied on the existence of a large outlier was observed. However, there was consistent correlation between surface areas of all MRI-defined regions and the surface area of the HV. The T/Bmax, typically located within the T1Gd region, was independent of the MRI-defined tumor size. Univariate survival analysis found the most significant predictors of survival to be HV, surface area of HV, surface area of T1Gd, and T/Bmax.
Conclusion: Hypoxia may drive the peripheral growth of glioblastomas. This conclusion supports the spatial link between the volumes and surface areas of the hypoxic and MRI regions; the magnitude of hypoxia, T/Bmax, remains independent of size.
Figures
References
-
- Silbergeld DL, Rostomily RC, Alvord ECJ. The cause of death in patients with glioblastoma is multifactorial: clinical factors and autopsy findings in 117 cases of supratentorial glioblastoma in adults. J Neurooncol. 1991;10:179–185. - PubMed
-
- Rasey JS, Koh WJ, Evans ML, et al. Quantifying regional hypoxia in human tumors with positron emission tomography of [18F]fluoromisonidazole: a pretherapy study of 37 patients. Int J Radiat Oncol Biol Phys. 1996;36:417–428. - PubMed
-
- Valk PE, Mathis CA, Prados MD, Gilbert JC, Budinger TF. Hypoxia in human gliomas: demonstration by PET with fluorine-18-fluoromisonidazole. J Nucl Med. 1992;33:2133–2137. - PubMed
-
- Brasch R, Pham C, Shames D, et al. Assessing tumor angiogenesis using macromolecular MR imaging contrast media. J Magn Reson Imaging. 1997;7:68–74. - PubMed
Publication types
MeSH terms
Substances
Grants and funding
LinkOut - more resources
Full Text Sources
Medical