

Altered central TRPV4 expression and lipid raft association related to inappropriate vasopressin secretion in cirrhotic rats
- PMID: 19091909
- PMCID: PMC2643982
- DOI: 10.1152/ajpregu.90460.2008
Altered central TRPV4 expression and lipid raft association related to inappropriate vasopressin secretion in cirrhotic rats
Abstract
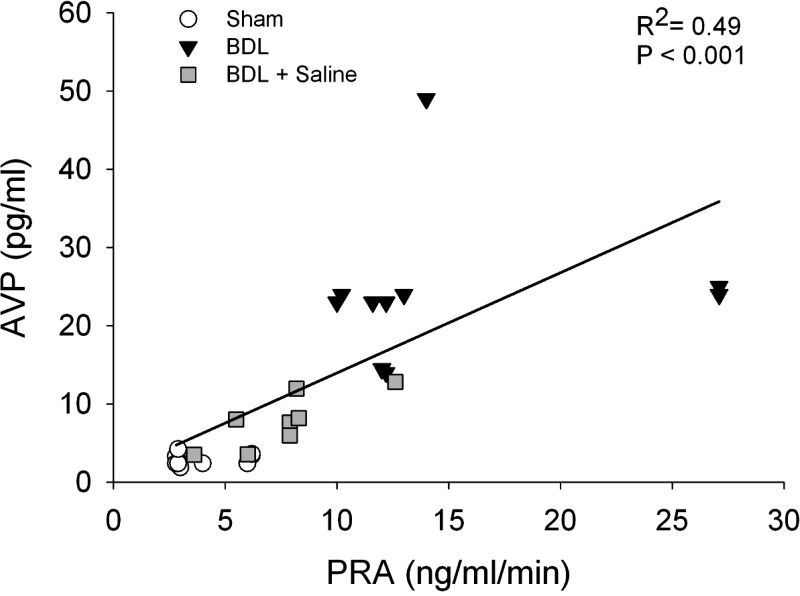
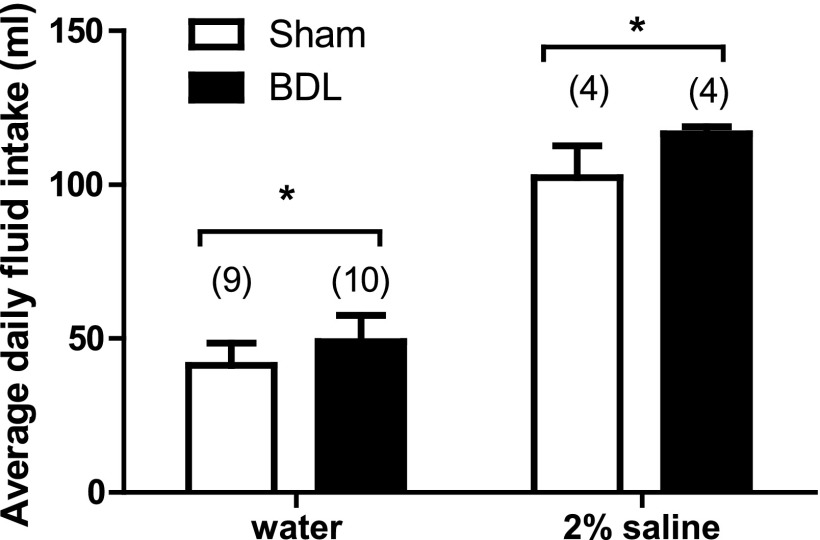
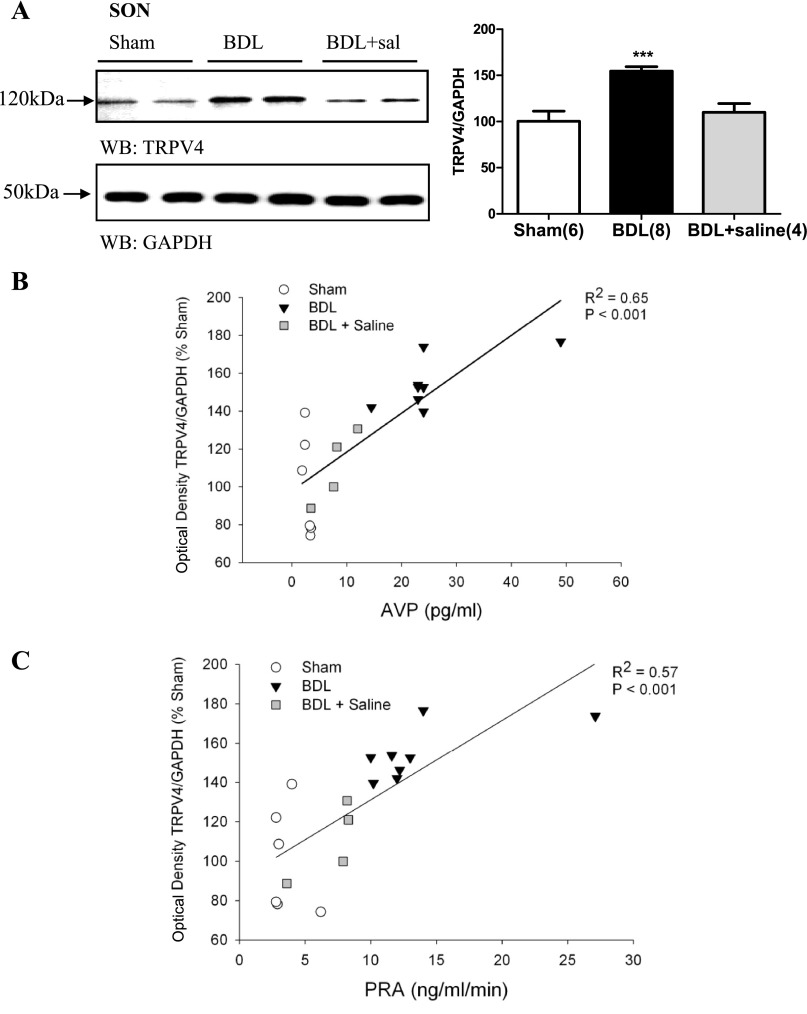
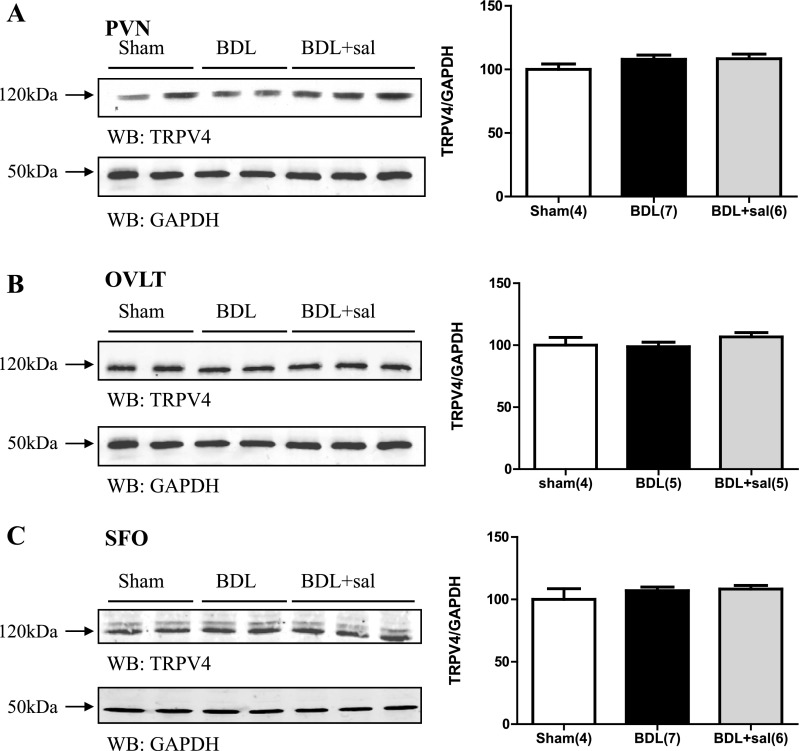
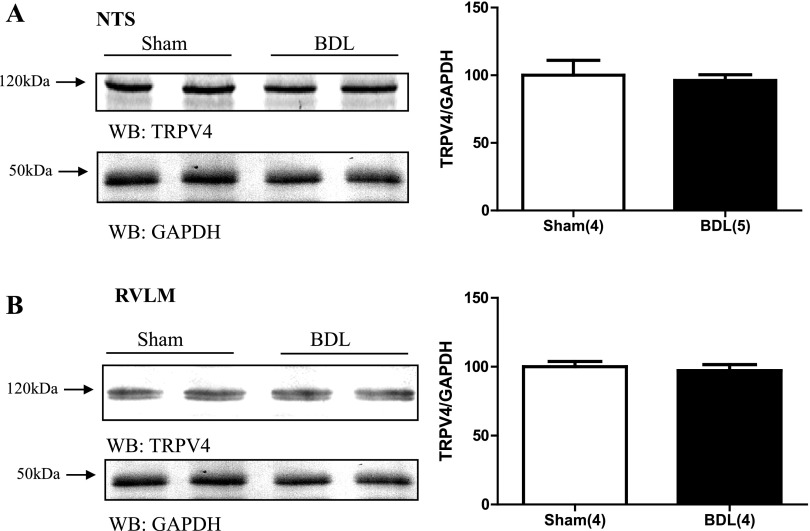
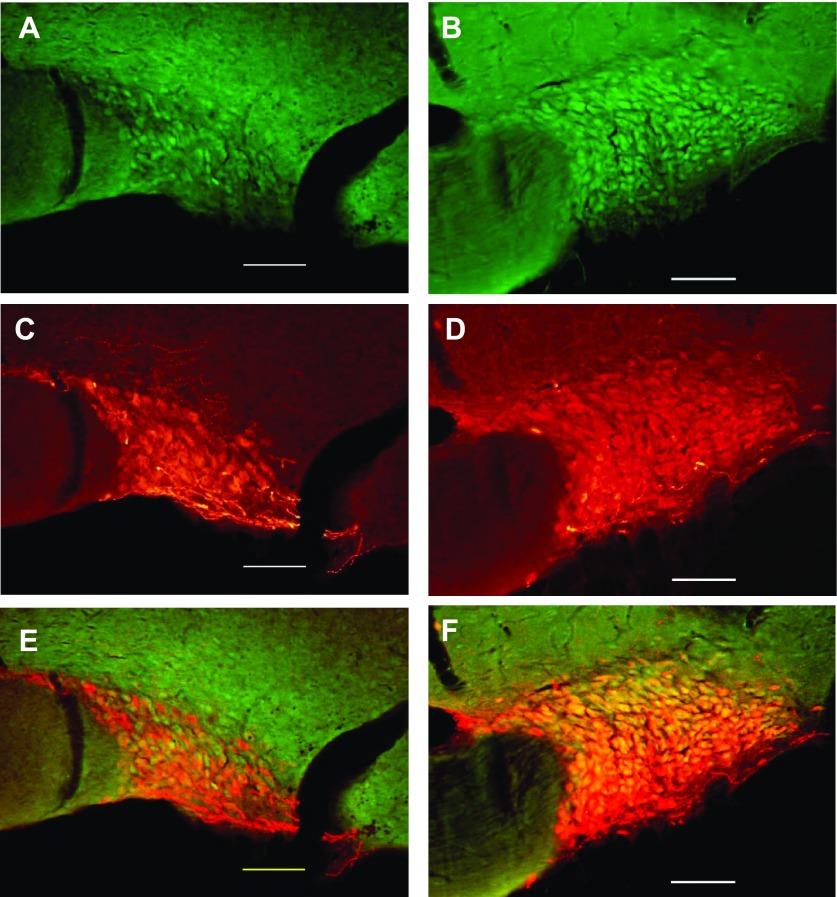
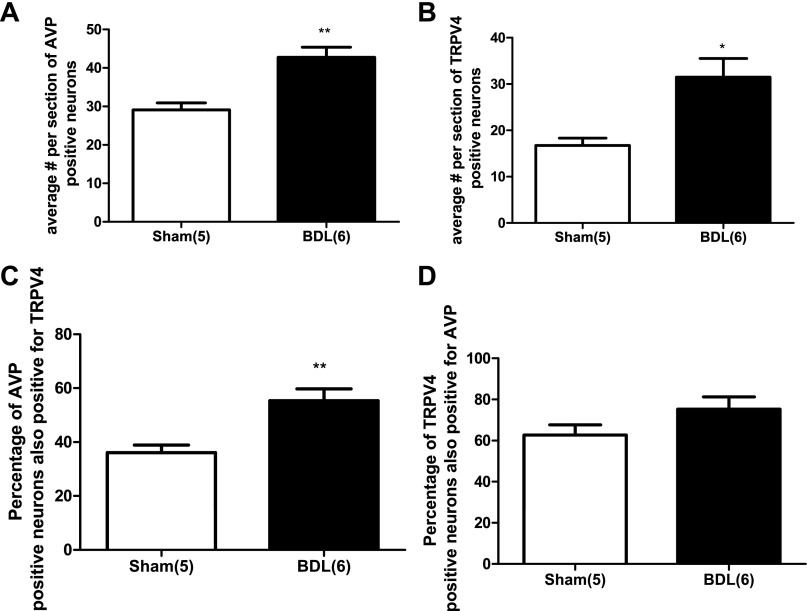
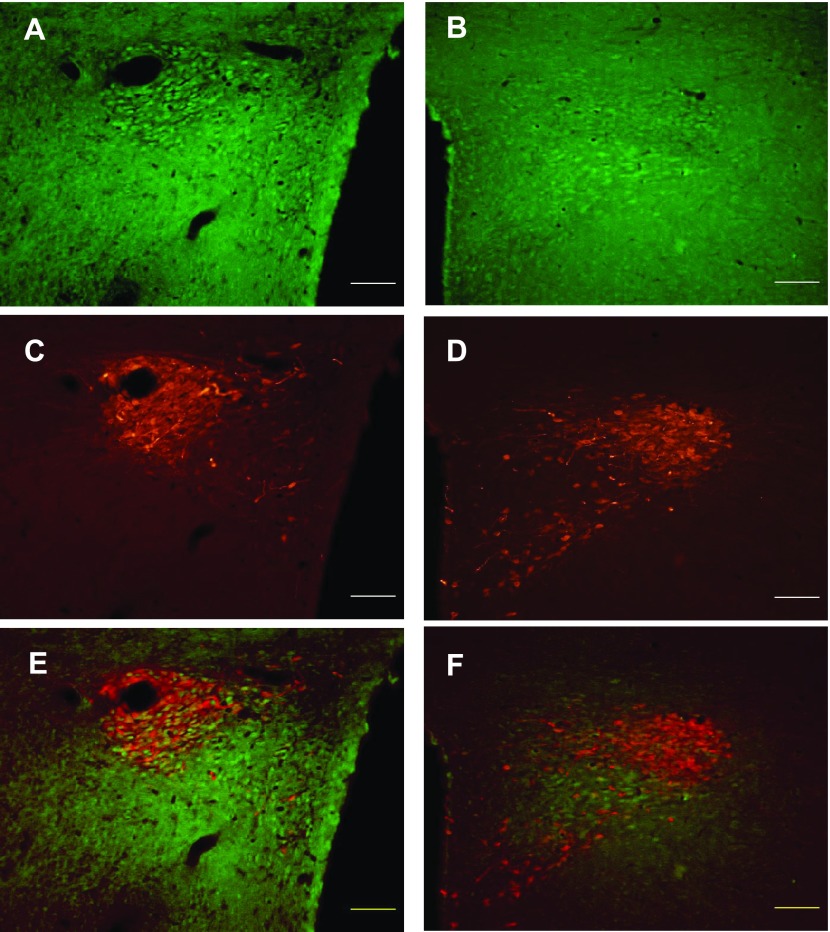
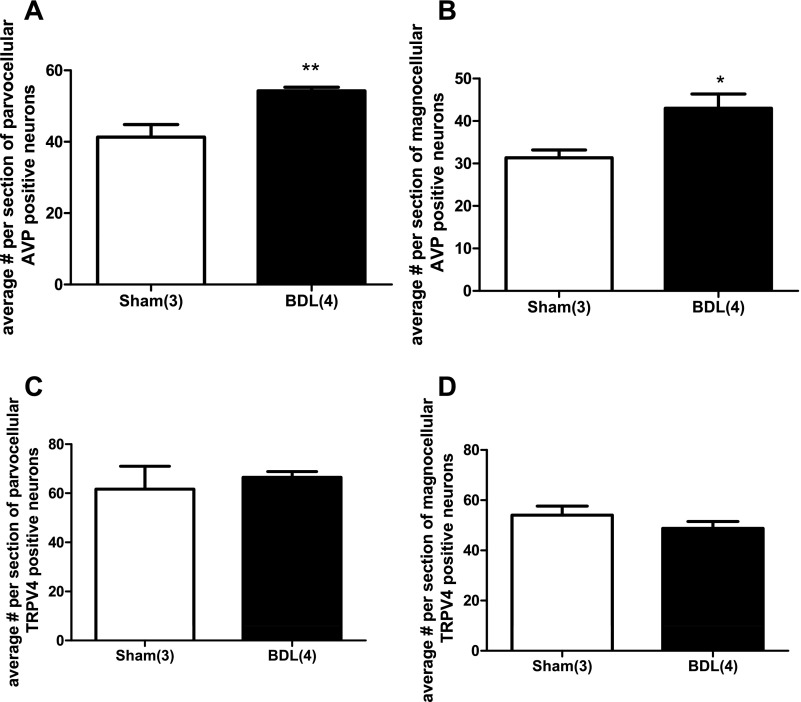
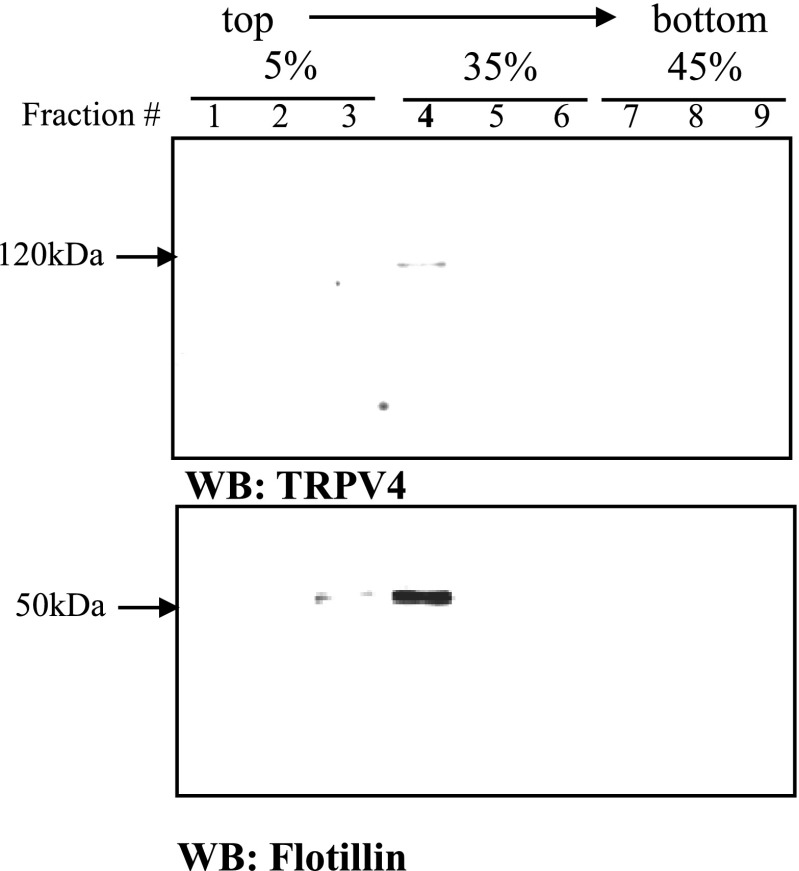
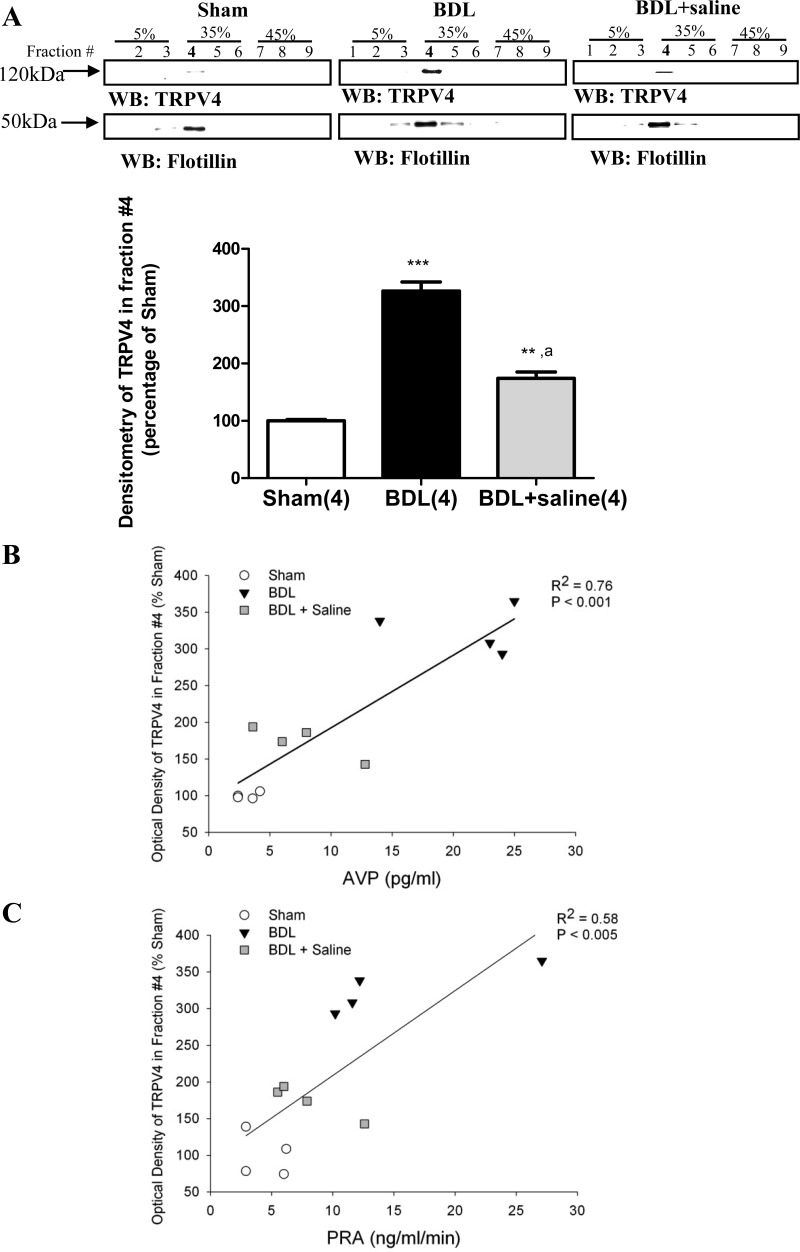
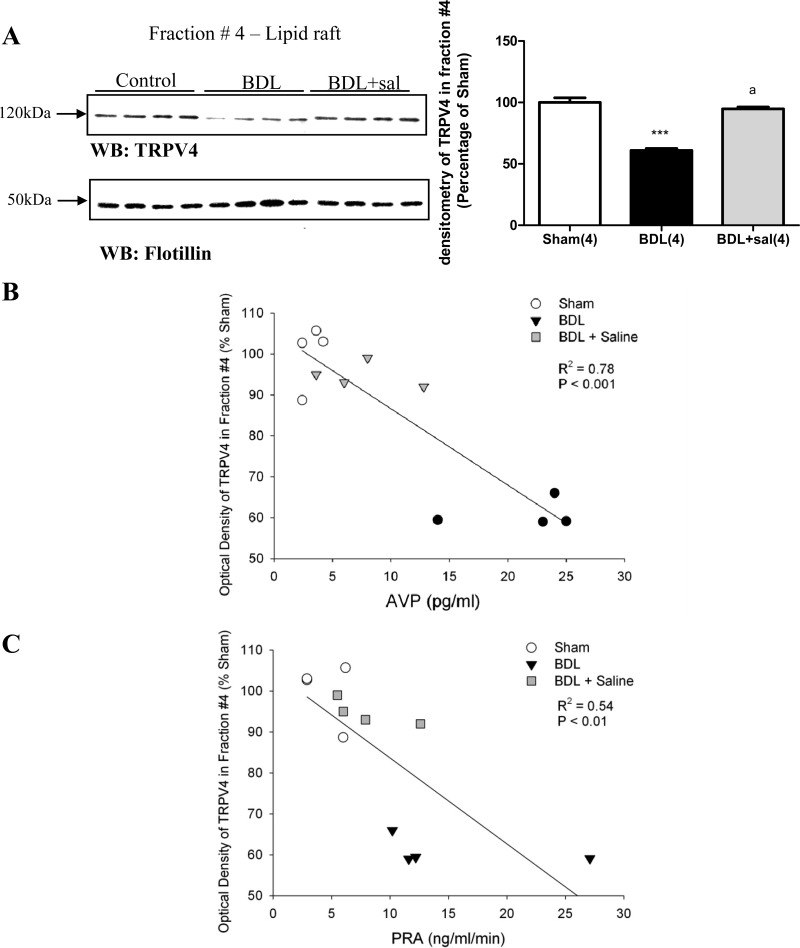
Inappropriate vasopressin (AVP) release causes dilutional hyponatremia in many pathophysiological states such as cirrhosis. The central molecular mechanisms that mediate inappropriate AVP release are unknown. We tested the hypothesis that changes in the expression or trafficking of TRPV4 in the central nervous system may contribute to inappropriate AVP release in the bile duct ligation (BDL) model of cirrhosis in the rat. Four weeks after surgery, BDL rats demonstrated significantly increased plasma vasopressin and plasma renin activity (PRA), hypervolemia, and decreased plasma osmolality. These effects were blocked by providing BDL rats with 2% saline to drink for 15 days. TRPV4 protein expression was significantly increased in brain punches from BDL rats containing the supraoptic nucleus (SON) of the hypothalamus (100% +/- 11 to 157% +/- 4.8), and this effect was blocked in BDL rats given saline. Immunohistochemistry demonstrated a significant increase in TRPV4-positive cells and the percentage of AVP neurons that also were TRPV4-positive in the SON of BDL rats. In the hypothalamus of BDL rats, TRPV4 lipid raft association increased compared with sham (from 100% +/- 2.1 to 326.1% +/- 16). This effect was significantly attenuated in BDL rats given 2% saline to drink (174% +/- 11). In the brain stem, TRPV4 lipid raft association was reduced by BDL and inversely related to plasma AVP and PRA. We speculate that changes in TRPV4 expression and compartmentalization within lipid rafts could contribute to a feed-forward mechanism related to AVP release in cirrhosis.
Figures
Similar articles
-
Region-specific changes in transient receptor potential vanilloid channel expression in the vasopressin magnocellular system in hepatic cirrhosis-induced hyponatraemia.J Neuroendocrinol. 2012 Apr;24(4):642-52. doi: 10.1111/j.1365-2826.2011.02273.x. J Neuroendocrinol. 2012. PMID: 22188460 Free PMC article.
-
Effects of bile duct ligation on the inhibitory control of supraoptic vasopressin neurons.J Neuroendocrinol. 2023 Jun;35(6):e13312. doi: 10.1111/jne.13312. Epub 2023 Jun 19. J Neuroendocrinol. 2023. PMID: 37337093 Free PMC article.
-
Brain-Derived Neurotrophic Factor and Supraoptic Vasopressin Neurons in Hyponatremia.Neuroendocrinology. 2020;110(7-8):630-641. doi: 10.1159/000503723. Epub 2019 Sep 27. Neuroendocrinology. 2020. PMID: 31557760 Free PMC article.
-
Regulation of arginine vasopressin in the syndrome of inappropriate antidiuresis.Am J Med. 2006 Jul;119(7 Suppl 1):S36-42. doi: 10.1016/j.amjmed.2006.05.006. Am J Med. 2006. PMID: 16843083 Review.
-
Whole-body volume regulation and escape from antidiuresis.Am J Med. 2006 Jul;119(7 Suppl 1):S21-9. doi: 10.1016/j.amjmed.2006.05.004. Am J Med. 2006. PMID: 16843081 Review.
Cited by
-
Role of Transient Receptor Potential Vanilloid 4 in Vascular Function.Front Mol Biosci. 2021 Apr 26;8:677661. doi: 10.3389/fmolb.2021.677661. eCollection 2021. Front Mol Biosci. 2021. PMID: 33981725 Free PMC article. Review.
-
Human skeletal dysplasia caused by a constitutive activated transient receptor potential vanilloid 4 (TRPV4) cation channel mutation.Exp Mol Med. 2012 Dec 31;44(12):707-22. doi: 10.3858/emm.2012.44.12.080. Exp Mol Med. 2012. PMID: 23143559 Free PMC article. Review.
-
Rapid Glucocorticoid-Induced Activation of TRP and CB1 Receptors Causes Biphasic Modulation of Glutamate Release in Gastric-Related Hypothalamic Preautonomic Neurons.Front Neurosci. 2013 Jan 31;7:3. doi: 10.3389/fnins.2013.00003. eCollection 2013. Front Neurosci. 2013. PMID: 23386808 Free PMC article.
-
Sex Differences in the Regulation of Vasopressin and Oxytocin Secretion in Bile Duct-Ligated Rats.Neuroendocrinology. 2021;111(3):237-248. doi: 10.1159/000508104. Epub 2020 Apr 24. Neuroendocrinology. 2021. PMID: 32335554 Free PMC article.
-
TRPV4 activation of endothelial nitric oxide synthase resists nonalcoholic fatty liver disease by blocking CYP2E1-mediated redox toxicity.Free Radic Biol Med. 2017 Jan;102:260-273. doi: 10.1016/j.freeradbiomed.2016.11.047. Epub 2016 Nov 29. Free Radic Biol Med. 2017. PMID: 27913210 Free PMC article.
References
-
- Anderson RJ, Chung HM, Kluge R, Schrier RW. Hyponatremia: a prospective analysis of its epidemiology and the pathogenetic role of vasopressin. Ann Intern Med 102: 164–168, 1985. - PubMed
-
- Armstrong WE Morphological and electrophysiological classification of hypothalamic supraoptic neurons. Prog Neurobiol 47: 291–339, 1995. - PubMed
-
- Bourque CW, Voisin DL, Chakfe Y. Stretch-inactivated cation channels: cellular targets for modulation of osmosensitivity in supraoptic neurons. Prog Brain Res 139: 85–94, 2002. - PubMed
-
- Bradford MM A rapid and sensitive method for the quantitation of microgram quantities of protein utilizing the principle of protein-dye binding. Anal Biochem 72: 248–254, 1976. - PubMed
Publication types
MeSH terms
Substances
Grants and funding
LinkOut - more resources
Full Text Sources
Medical
Research Materials
Miscellaneous