. 2009 Mar;101(3):1283-93.
doi: 10.1152/jn.91026.2008. Epub 2008 Dec 17.

Activity-dependent plasticity improves M1 motor representation and corticospinal tract connectivity

Affiliations

Activity-dependent plasticity improves M1 motor representation and corticospinal tract connectivity

S Chakrabarty et al. J Neurophysiol. 2009 Mar.

Abstract

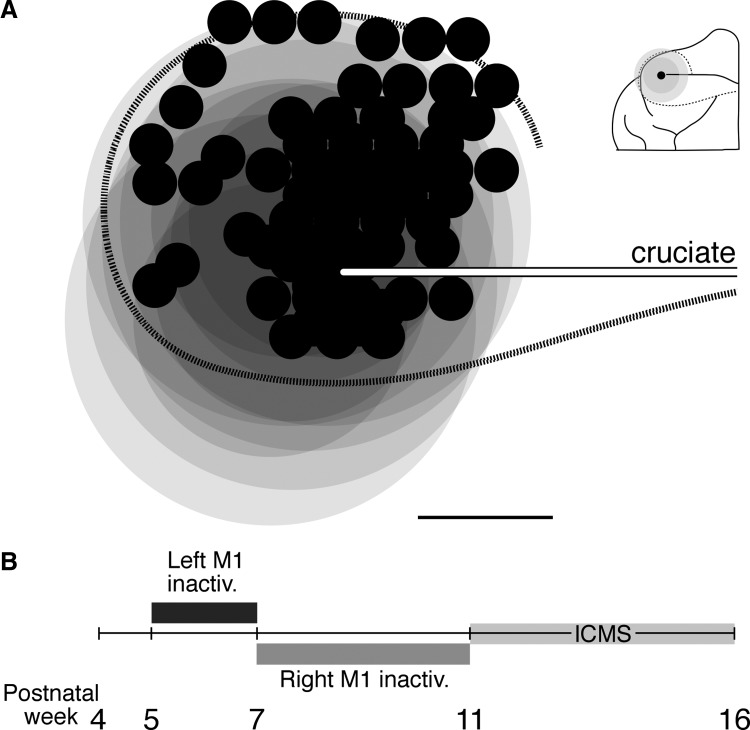
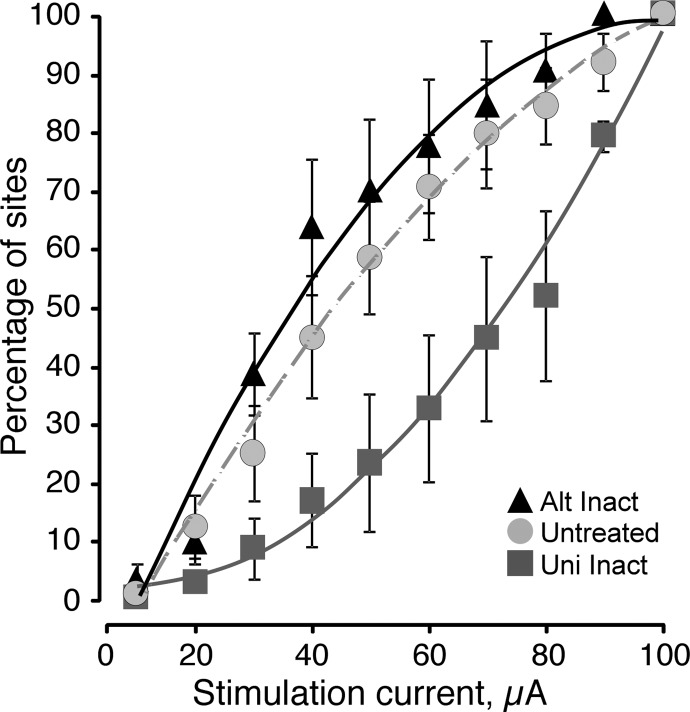
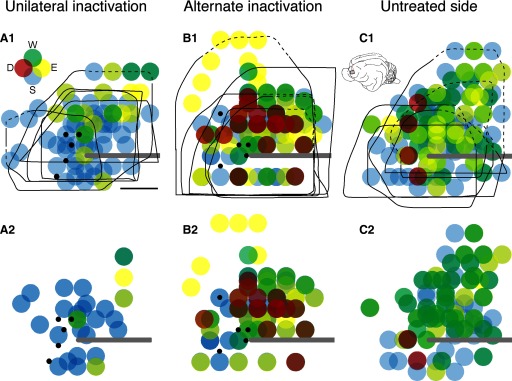
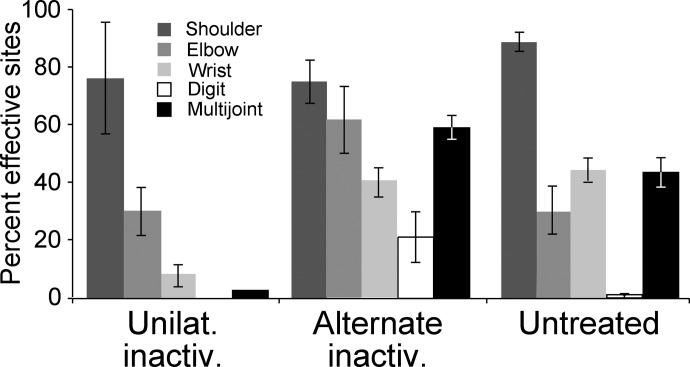
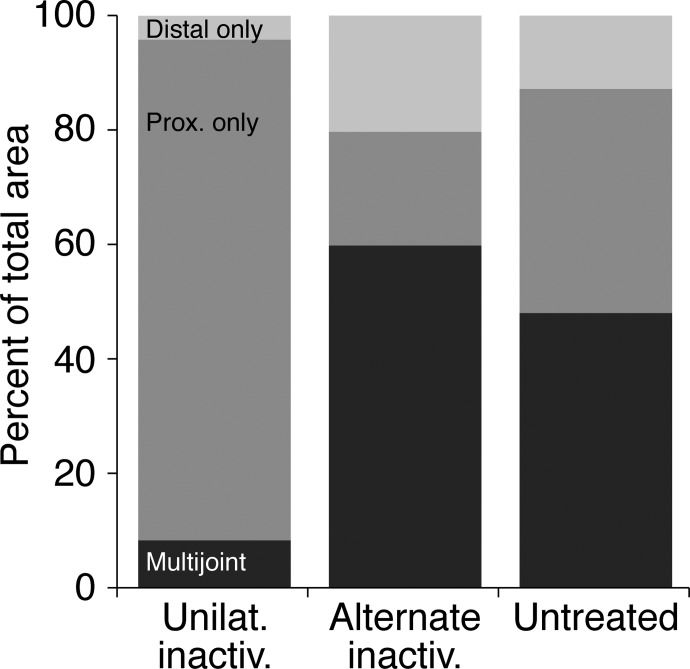
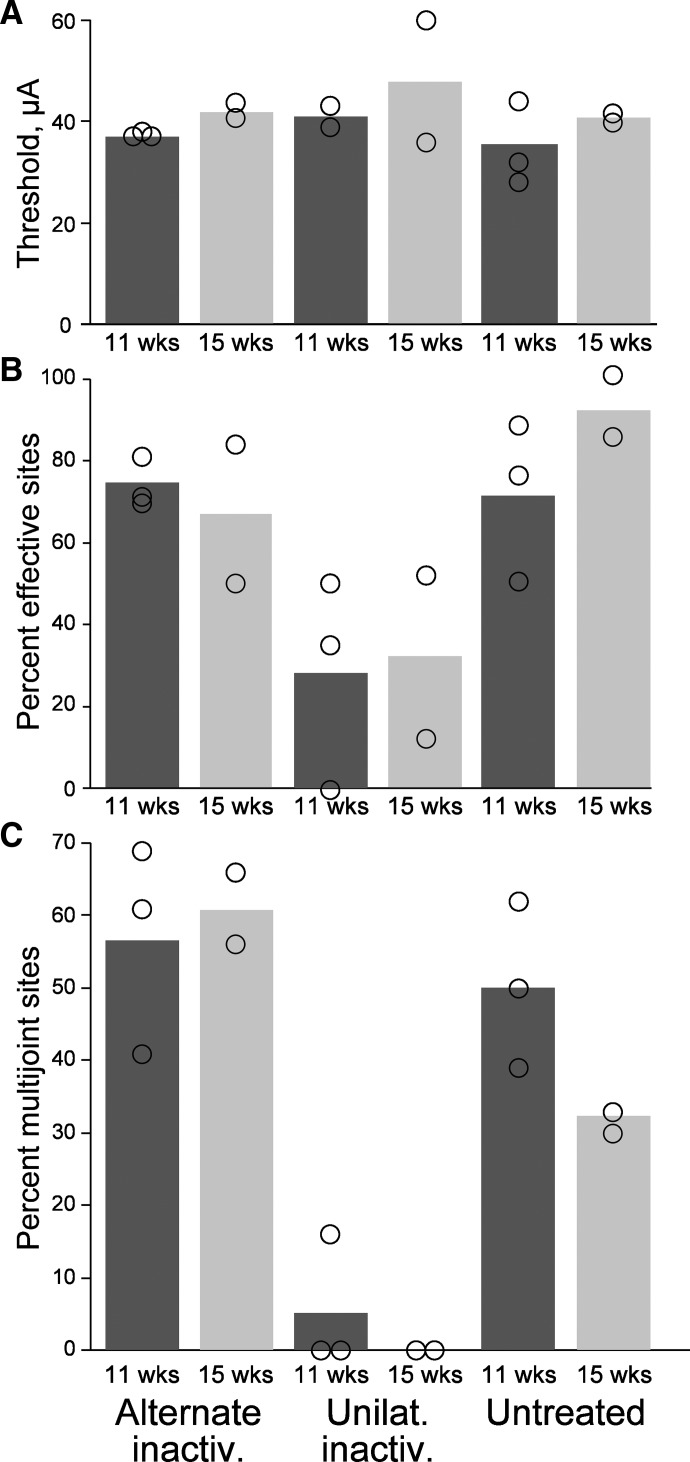
Motor cortex (M1) activity between postnatal weeks 5 and 7 is essential for normal development of the corticospinal tract (CST) and visually guided movements. Unilateral reversible inactivation of M1, by intracortical muscimol infusion, during this period permanently impairs development of the normal dorsoventral distribution of CST terminations and visually guided motor skills. These impairments are abrogated if this M1 inactivation is followed by inactivation of the contralateral, initially active M1, from weeks 7 to 11 (termed alternate inactivation). This later period is when the M1 motor representation normally develops. The purpose of this study was to determine the effects of alternate inactivation on the motor representation of the initially inactivated M1. We used intracortical microstimulation to map the left M1 1 to 2 mo after the end of left M1 muscimol infusion. We compared representations in the unilateral inactivation and alternate inactivation groups. Alternate inactivation converted the sparse proximal M1 motor representation produced by unilateral inactivation to a complete and high-resolution proximal-distal representation. The motor map was restored by week 11, the same age that our present and prior studies demonstrated that alternate inactivation restored CST spinal connectivity. Thus M1 motor map developmental plasticity closely parallels plasticity of CST spinal terminations. After alternate inactivation reestablished CST connections and the motor map, an additional 3 wk was required for motor skill recovery. Since motor map recovery preceded behavioral recovery, our findings suggest that the representation is necessary for recovering motor skills, but additional time, or experience, is needed to learn to take advantage of the restored CST connections and motor map.


Figures

FIG. 1.
FIG. 1.
Stimulation sites were within the inactivated region and experimental timeline. A: all stimulation sites (small black circles) in all animals are shown, aligned according to the lateral tip of the cruciate sulcus (white line with black border). Darker gray circles correspond to the region of maximal activity reduction (3-mm radius) for each infusion and the lighter gray circles indicate region of reduced activity reduction for each infusion, based on cytochrome oxidase staining (Martin et al. 1999) and supplemented with parvalbumin immunohistochemistry (Friel et al. 2007). The dotted black line corresponds approximately to the area 4γ border. Inset shows a schematic representation of an example infusion site at the lateral tip of the cruciate sulcus and associated regions of maximal (dark gray) and reduced (light gray) inactivation. Cal. 3 mm. B: timeline showing the ages at which left primary motor cortex (M1) and right M1 inactivations took place.
FIG. 2.
FIG. 2.
Stimulus–motor response relations are affected by unilateral and alternate inactivation. Data are from the inactivated M1 in unilateral inactivation animals, the initially inactivated M1 in alternate inactivation animals, and M1 on the untreated side in the animals subjected to unilateral inactivation (i.e., no inactivation). Data from all animals (weeks 11–16) are pooled. Maximal current for this analysis was 100 μA. The plot shows cumulative percentage of sites that were effective in relation to increasing intracortical microstimulation (ICMS) current. (r values for line fits. Untreated: r = 0.994; unilateral inactivation: r = 0.989; alternate inactivation: r = 0.978).
FIG. 3.
FIG. 3.
Changes in M1 motor representation after unilateral and alternate inactivation. Each colored circle plots the joint effect obtained by stimulation. Data from all experiments are superimposed, with effects obtained at <100 μA shown in the top row and <60 μA, in the bottom row. The black lines in the top row mark the boundaries of the forelimb representation. The dashed portion of the lines correspond to the bony limit of the craniotomy, which was at or very close to the area 4γ border in that experiment. The inset in A1 shows the color coding used (D, digits; W, wrist; E, elbow; S, shoulder) and, in C1, the cat brain and the region explored. Each dot was plotted as 50% transparent, with distal shown as the most superficial graphical layer and proximal, the deepest. A: unilateral inactivated (left) M1. B: alternate inactivation (i.e., the left side, which received the initial inactivation between weeks 5–7, but examined after inactivation of the other M1 from weeks 7–11). C: untreated M1 (i.e., right; contralateral to the M1 that received unilateral inactivation only). Small black dots indicate the infusion sites. Calibration: 2 mm.
FIG. 4.
FIG. 4.
Proximal sites are represented predominantly after unilateral inactivation, whereas both proximal and distal sites are represented after alternate inactivation. Data from the M1 that received unilateral inactivation (between weeks 5 and 7 only; A), M1 that received the initial inactivation between weeks 5 and 7, but examined after inactivation of the other M1 from weeks 7 to 11 (alternate inactivation; B) and the untreated M1 (C) are shown.
FIG. 5.
FIG. 5.
Percentage of total map area devoted to the representation of proximal joints (shoulder and elbow), distal joints (wrist and digits), or proximal–distal multijoint. Data from the M1 that received unilateral inactivation (between weeks 5 and 7 only), M1 that received the initial inactivation between weeks 5 and 7, but examined after inactivation of the other M1 from weeks 7 to 11 (alternate inactivation) and the untreated M1, are shown.
FIG. 6.
FIG. 6.
The M1 motor representations at weeks 11 through 13 and 14 through 16 are not different. Bars plot mean values. Open circles plot data values from individual animals comprising the 2 ages for each group. Column labeled “11 wks” plots data for animals between weeks 11 and 13. Column labeled “15 wks” plots data for animals between weeks 14 and 16.

Similar articles

Cited by

References

    1. Alstermark B, Isa T, Tantisira B. Projection from excitatory C3–C4 propriospinal neurones to spinocerebellar and spinoreticular neurones in the C6–Th1 segments of the cat. Neurosci Res 8: 124–130, 1990. - PubMed
    1. Alstermark B, Kümmel H. Transneuronal transport of wheat germ agglutinin conjugated horseradish peroxidase into last order spinal interneurones projecting to acromio- and spinodeltoideus motoneurones in the cat. 2. Differential labelling of interneurones depending on movement type. Exp Brain Res 80: 96–103, 1990. - PubMed
    1. Alstermark B, Lundberg A, Norrsell U, Sybirska E. Integration in the descending motor pathways controlling the forelimb in the cat. 9. Differential behavioural defects after spinal cord lesion interrupting defined pathways from higher centers to motoneurons. Exp Brain Res 42: 299–318, 1981. - PubMed
    1. Alstermark B, Ohlson S. Origin of corticospinal neurones evoking monosynaptic excitation in C3–C4 propriospinal neurones in the cat. Neurosci Res 38: 249–256, 2000. - PubMed
    1. Armstrong DM, Drew T. Electromyographic responses evoked in muscles of the forelimb by intracortical stimulation in the cat. J Physiol 367: 309–326, 1985. - PMC - PubMed

Publication types

LinkOut - more resources