. 2009 Feb;101(2):1073-88.
doi: 10.1152/jn.90902.2008. Epub 2008 Dec 17.

Temporal structure of receptor neuron input to the olfactory bulb imaged in behaving rats

Affiliations

Temporal structure of receptor neuron input to the olfactory bulb imaged in behaving rats

Ryan M Carey et al. J Neurophysiol. 2009 Feb.

Abstract

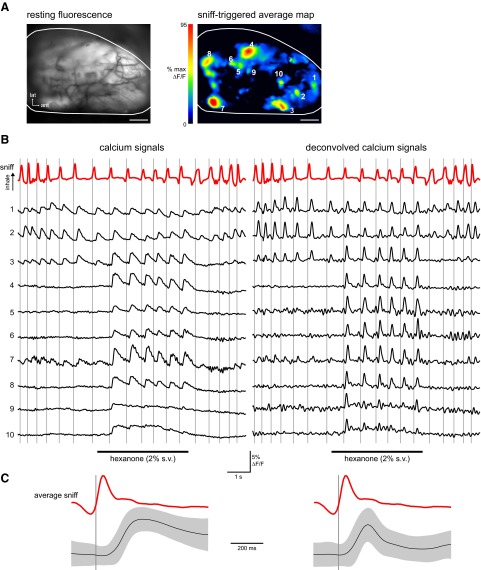
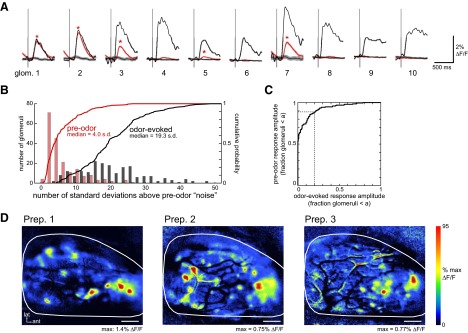
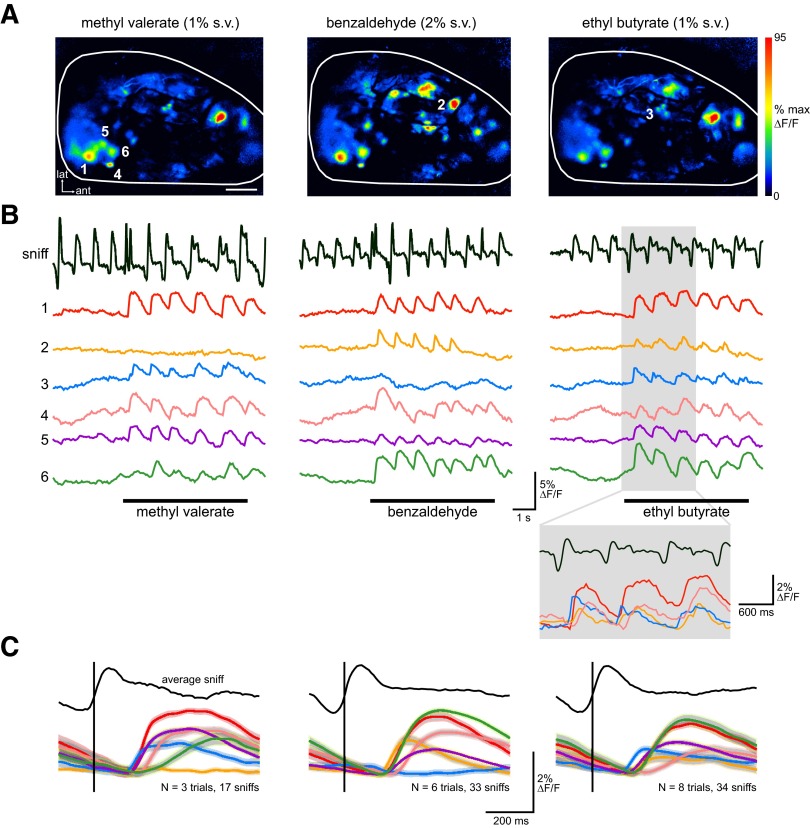
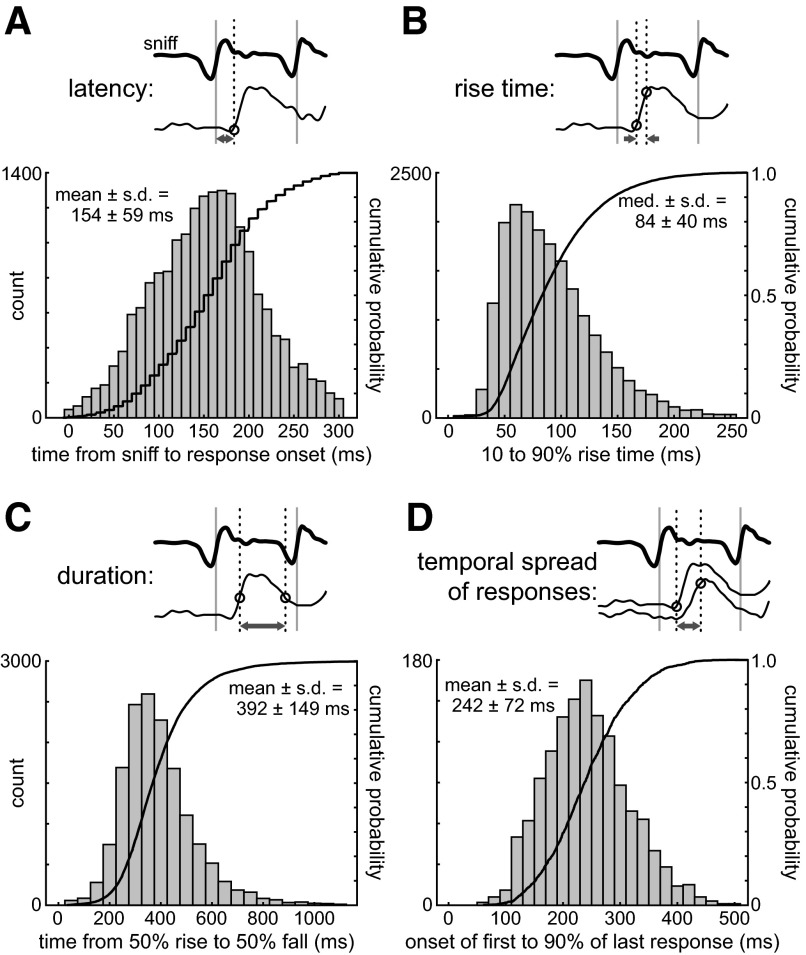
The dynamics of sensory input to the nervous system play a critical role in shaping higher-level processing. In the olfactory system, the dynamics of input from olfactory receptor neurons (ORNs) are poorly characterized and depend on multiple factors, including respiration-driven airflow through the nasal cavity, odorant sorption kinetics, receptor-ligand interactions between odorant and receptor, and the electrophysiological properties of ORNs. Here, we provide a detailed characterization of the temporal organization of ORN input to the mammalian olfactory bulb (OB) during natural respiration, using calcium imaging to monitor ORN input to the OB in awake, head-fixed rats expressing odor-guided behaviors. We report several key findings. First, across a population of homotypic ORNs, each inhalation of odorant evokes a burst of action potentials having a rise time of about 80 ms and a duration of about 100 ms. This rise time indicates a relatively slow, progressive increase in ORN activation as odorant flows through the nasal cavity. Second, the dynamics of ORN input differ among glomeruli and for different odorants and concentrations, but remain reliable across successive inhalations. Third, inhalation alone (in the absence of odorant) evokes ORN input to a significant fraction of OB glomeruli. Finally, high-frequency sniffing of odorant strongly reduces the temporal coupling between ORN inputs and the respiratory cycle. These results suggest that the dynamics of sensory input to the olfactory system may play a role in coding odor information and that, in the awake animal, strategies for processing odor information may change as a function of sampling behavior.


Figures

FIG. 1.
FIG. 1.
Sensory input to olfactory bulb (OB) glomeruli is tightly coupled to respiration. A, left: resting fluorescence from the dorsal OB of an awake rat in which olfactory receptor neurons (ORNs) were loaded with calcium-sensitive dye. Right: “sniff-triggered average” map of inhalation-evoked fluorescence changes evoked by inhalation of the odorant 2-hexanone. The map is the average of 37 “sniffs” in 10 trials. Scale bar: 500 μm. B, left: respiration (“sniff,” red trace) and ORN presynaptic calcium signals (black traces) from the 10 glomeruli shown in A during a presentation of 2-hexanone. In most glomeruli, signal activation is linked to respiration and increases in the presence of the odorant. Some glomeruli show responses before odorant presentation. Vertical lines indicate the onset time of each inhalation. Right: same data but with the calcium signals temporally deconvolved to give estimated temporal patterns of action potential firing during the trial (see methods). C, left: average calcium signal waveform (left) evoked by odorant inhalation. Black trace shows the mean of all responses evoked by the first sniff after odorant presentation began, averaged across all trials regardless of odorant and glomerulus (data were included only if there was a minimum of 400 ms between the first and second sniffs: n = 837 trials, 5,776 sniff responses). Responses were normalized to their peak amplitude and aligned to the start of inhalation before averaging. Gray area indicates the SD of the mean response waveform. Red trace shows the average sniff waveform. Right: average deconvolved waveform, using the same data set.
FIG. 2.
FIG. 2.
ORN input to some glomeruli is driven by inhalation even in the absence of odorant. A: comparison of sniff-evoked optical signals before (red) and during (black) odorant presentation for the 10 glomeruli shown in Fig. 1. Single black traces show responses to the first inhalation of 2-hexanone (same data as in Fig. 1B). Red traces show sniff-triggered average signals for all sniffs occurring before odorant presentation in all trials in that session (n = 35 trials, 128 sniffs). Also shown are “randomly triggered” average traces made by random selection of signal epochs during the preodor phase (see results). Shaded areas indicate SEs of the average traces. Asterisks (*) indicate glomeruli for which the sniff-triggered response was significantly greater than the randomly triggered control (see results). B: histogram and cumulative probability distributions of sniff-triggered response amplitudes of glomeruli before (red) and during (black) odorant presentation. Odorant-evoked response amplitudes were averaged across all sniffs for each odorant and only the greatest response (i.e., the most effective odorant) was used for that glomerulus. Amplitudes are expressed relative to the SD of the randomly triggered control for that glomerulus. Only data from the 3 animals with the highest number of tested odorants were included (n = 194 trials). Histogram bin size: 2 SD. C: receiver-operating characteristic curve comparing the distributions of responses (taken from B) evoked before (ordinate) and during (abscissa) odorant presentation. Each axis is the fraction of all glomeruli with responses below a particular amplitude cutoff, “a.” The dotted lines compare the distributions at an arbitrarily chosen cutoff value of 0.25 of all odorant-evoked response amplitudes, showing that roughly 90% of glomeruli show preodorant responses smaller than this value. D: location of inhalation-activated glomeruli in 3 different animals. Sniff-triggered maps were generated from all sniffs taken before odorant presentation. In each preparation, a cluster of glomeruli in the anterior–medial dorsal OB was most strongly activated by inhalation, although there were glomeruli throughout the dorsal OB that also responded strongly.
FIG. 3.
FIG. 3.
Temporal dynamics of ORN inputs differ across glomeruli and between odorants. A: sniff-triggered average response maps for 3 different odorants eliciting input to different but overlapping ensembles of dorsal OB glomeruli. Scale bar: 500 μm. B: traces showing optical signals in 6 glomeruli (locations shown in A) for one trial for each of the 3 odorants. The inset in the ethyl butyrate trial shows an expansion of the gray shaded area, showing consistent response dynamics repeated with successive sniffs of odorant. C: sniff-triggered average traces for the 6 glomeruli for each odorant, showing that odorant- and glomerulus-specific response dynamics are consistently evoked across sniffs. Shaded areas indicate SE of each averaged trace. Vertical line indicates the start of inhalation to which each response was aligned prior to averaging.
FIG. 4.
FIG. 4.
Summary of ORN input dynamics for all glomeruli and odorants. A: histogram and cumulative probability plot of the latency of the optical signal following an inhalation. In this and other panels, the schematic above each histogram illustrates the parameter measured (arrows), using a sample sniff trace (bold) and sample optical response (thin trace). Parameter measurements are based on only the first sniff after the onset of odorant presentation, pooled across animals, sessions, odorants, trials, and glomeruli. Time bin is 10 ms. B: histogram and cumulative probability plot of the rise time of the optical signal response (t10 to t90 of the peak response amplitude). Time bin is 10 ms. C: histogram and cumulative probability plot of the duration of the optical signal responses (time during which the response is >50% peak amplitude). Time bin is 50 ms. D: histogram and cumulative probability plot of the temporal spread of optical signal responses from all glomeruli in a trial. Temporal spread is the time from the onset of the earliest glomerular response in a trial to the time when all glomeruli have reached 90% of their peak amplitudes. Only trials with ≥5 responsive glomeruli were included. Time bin is 10 ms.
FIG. 5.
FIG. 5.
Temporal dynamics of ORN input evoked by patterned electrical stimulation. A: traces showing the optical signal imaged from one glomerulus after in vivo electrical stimulation of the olfactory nerve (see methods). Each trace shows the response to a different stimulus pattern (indicated below). Stimulus protocols consist of a single ON shock (“1,” purple), a train of 3 pulses at 100 Hz (“2,” green), a train of 28 pulses at 100 Hz (“3,” blue), and a train of 28 pulses but with patterned increases in intensity through the train (“4,” red). The arrow indicates the initiation of stimulation. Signals are averages of multiple (4–8) trials and are unfiltered. All traces are from the same glomerulus and are normalized to the same peak amplitude. B: comparison of the average shock-evoked responses (n for each protocol given in the text; same color coding as in A) with the average inhalation-evoked odorant response in an awake rat (black with gray shaded SD, reproduced from Fig. 1C). All traces are aligned to the initiation of the calcium response following the stimulation (arrow) and normalized to the same peak amplitude. Pattern 4 best replicates the time course of a sniff-evoked odorant response to odorant. See results for additional analysis.
FIG. 6.
FIG. 6.
Effect of odorant concentration on magnitude and dynamics of ORN inputs. A: sniff-triggered average maps showing the optical response of the same preparation to 4 different concentrations of the odorant benzaldehyde. Maps are scaled to their own peak amplitudes (indicated below each map). Increasing odorant concentration recruits ORN input to new glomeruli with a modest increase in maximal response amplitude. Scale bar: 500 μm. B: respiration (red) and optical signals (black) recorded from the 5 glomeruli indicated in A while presenting 3 different concentrations of benzaldehyde. Glomeruli 1 and 2 are recruited by higher concentrations, glomerulus 3 responses become more reliable, and glomerulus 4 responses appear to increase in duration at higher concentration. The noise in glomerulus 5 is due to its proximity to a blood vessel. C: concentration–response functions plotted for glomeruli in 4 concentration series (2 series in each of 2 animals). Each plot shows the averaged, normalized amplitude of all activated glomeruli in a series. Responses from individual glomeruli were averaged across multiple (2–6, typically 4) trials and normalized to the response at the highest concentration tested, after which responses were averaged across all glomeruli in the series. Amplitude is measured from the first response following odorant onset. Normalized response amplitudes to inhalation alone (“no odor”) are shown at the far left of the x-axis. The benzaldehyde series (blue; n = 17 trials, 5 glomeruli) is the same preparation as from A and B. Other odorants shown are hexanone (red; n = 6 trials, 11 glomeruli); methyl valerate (gray; n = 14 trials, 5 glomeruli); and a 4-component mixture (see methods) (green; n = 14 trials, 13 glomeruli). Note that x-axis units are percentage saturated vapor. D: odorant concentration vs. rise time for signals imaged in response to the same odorant concentration series shown in C. Each plot indicates a different odorant series, with rise times averaged across all glomeruli as in C. Plot colors are the same as in C. Only glomeruli showing responses with a signal-to-noise ratio >4 at all concentrations were included. E: odorant concentration vs. onset latency, averaged and plotted for each concentration series as in D. Both rise time and latencies show modest effects of concentration.
FIG. 7.
FIG. 7.
Effect of sniff frequency on respiratory patterning of ORN inputs. A: optical signals and respiration (“sniff”) measured during 2 presentations of ethyl butyrate. Right traces show a high-frequency sniffing response to ethyl butyrate (presented for the first time in this case); left traces show response to low-frequency sampling of ethyl butyrate after habituation to the odorant. Gray area indicates region over which coherence with respiration was measured and includes the time of odorant presentation after the second inhalation of odorant. Bold gray trace shows the simplified sniff waveform used in the coherence measurements (see results). B: optical signals and respiration during 2 presentations of a different odorant (valeric acid). The behavioral session and glomerulus imaged is the same as in A. Valeric acid evokes an initial response with a similar amplitude to that evoked by ethyl butyrate, but the response shows less coherence loss during high-frequency sniffing. C and D: power spectra (left plots) and coherence functions for the data shown in A and B. The leftmost plot shows the power spectra of the optical (black) and simplified sniff (gray) waveforms during the low-frequency trial. There are local maxima in both spectra at 1.54 Hz (the mean sniff frequency). The estimated magnitude squared coherence functions between the optical signal and simplified sniff are shown for both low- and high-frequency trials. Points indicate the coherence value at the mean sniff respiration for each trial. Coherence peaks are near this frequency in all cases. E: scatterplot of coherence values for high- vs. low-frequency sniffing of the same odorant/glomerulus pair (n = 109 pairs). Coherence values were obtained from a single high-frequency trial and averaged across multiple low-frequency trials. Symbols correspond to the values obtained in the examples of A and B. F: change in coherence from low- to high-frequency sniffing trials plotted as a function of initial response amplitude (measured during low-frequency sniffing), using the same data as in E. Response amplitude is normalized to the maximal response observed in that glomerulus to any odorant, which reflects the intrinsic dynamic range of that glomerulus. There is no clear relationship. G: change in coherence as a function of response duration, using a subset (n = 83 pairs) of the data in E and F. There is no clear relationship.

Similar articles

Cited by

References

    1. Abraham NM, Spors H, Carleton A, Margrie TW, Kuner T, Schaefer AT. Maintaining accuracy at the expense of speed: stimulus similarity defines odor discrimination time in mice. Neuron 44: 865–876, 2004. - PubMed
    1. Adrian ED Olfactory reactions in the brain of the hedgehog. J Physiol 100: 459–473, 1942. - PMC - PubMed
    1. Arevian AC, Kapoor V, Urban NN. Activity-dependent gating of lateral inhibition in the mouse olfactory bulb. Nat Neurosci 11: 80–87, 2008. - PMC - PubMed
    1. Balu R, Larimer P, Strowbridge BW. Phasic stimuli evoke precisely timed spikes in intermittently discharging mitral cells. J Neurophysiol 92: 743–753, 2004. - PubMed
    1. Bathellier B, Buhl DL, Accolla R, Carleton A. Dynamic ensemble odor coding in the mammalian olfactory bulb: sensory information at different timescales. Neuron 57: 586–598, 2008. - PubMed

Publication types

LinkOut - more resources