. 2008 Dec 23;105(51):20380-5.
doi: 10.1073/pnas.0810485105. Epub 2008 Dec 17.

Highly parallel identification of essential genes in cancer cells

Affiliations

Highly parallel identification of essential genes in cancer cells

Biao Luo et al. Proc Natl Acad Sci U S A. .

Abstract

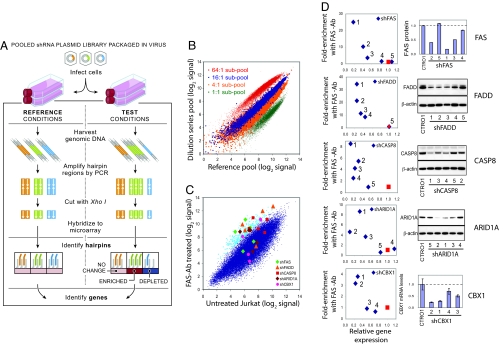
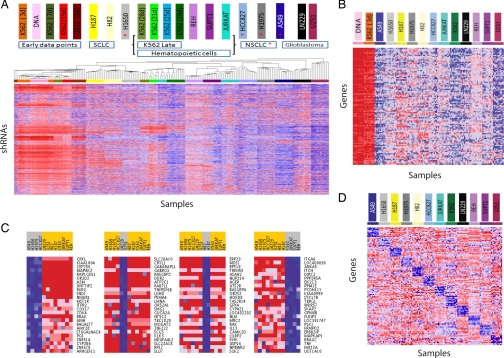
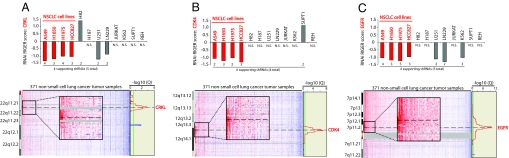
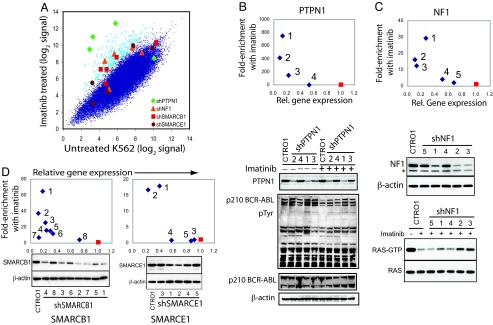
More complete knowledge of the molecular mechanisms underlying cancer will improve prevention, diagnosis and treatment. Efforts such as The Cancer Genome Atlas are systematically characterizing the structural basis of cancer, by identifying the genomic mutations associated with each cancer type. A powerful complementary approach is to systematically characterize the functional basis of cancer, by identifying the genes essential for growth and related phenotypes in different cancer cells. Such information would be particularly valuable for identifying potential drug targets. Here, we report the development of an efficient, robust approach to perform genome-scale pooled shRNA screens for both positive and negative selection and its application to systematically identify cell essential genes in 12 cancer cell lines. By integrating these functional data with comprehensive genetic analyses of primary human tumors, we identified known and putative oncogenes such as EGFR, KRAS, MYC, BCR-ABL, MYB, CRKL, and CDK4 that are essential for cancer cell proliferation and also altered in human cancers. We further used this approach to identify genes involved in the response of cancer cells to tumoricidal agents and found 4 genes required for the response of CML cells to imatinib treatment: PTPN1, NF1, SMARCB1, and SMARCE1, and 5 regulators of the response to FAS activation, FAS, FADD, CASP8, ARID1A and CBX1. Broad application of this highly parallel genetic screening strategy will not only facilitate the rapid identification of genes that drive the malignant state and its response to therapeutics but will also enable the discovery of genes that participate in any biological process.


Conflict of interest statement

The authors declare no conflict of interest.

Figures

Fig. 1.
Fig. 1.
Pooled RNAi screening strategy and performance using pools of 45,000 shRNA-expressing viruses. (A) Schematic of pooled shRNA library screens. (B) Performance evaluation of half-hairpin barcodes (hhbs) using pools containing known relative proportions of DNA. Two 45,000-shRNA pools were created by combining 4 subsets of the shRNA library plasmids (labeled in green, orange, blue, and red, each consisting of ≈11,000 different plasmids) in a 1:1:1:1 ratio of concentration for the “Reference pool” and in a 1:4:16:64 ratio for the “Dilution series pool.” To measure relative shRNA abundance in each pool, hhbs were hybridized to a custom Affymetrix barcode array. The observed separation of the 4 subsets of shRNAs according to their known relative proportions in the 2 pools illustrates the ability of hhbs to deconvolute the pooled shRNA library. (C) Primary screen results for genes required for FAS-induced apoptosis in Jurkat T cells. Cells were infected with the 45k pool viral library and cultured in the presence or absence of activating FAS antibody CH11 (FAS-Ab) for 3 weeks. Hybridization signals for hhbs amplified from the FAS-Ab treated group (average of 5 replicates) are plotted against those from the untreated group (average of 10 replicates). Array data for the 400 shRNAs (0.9% of pool) exhibiting highest enrichment in FAS-Ab treated group relative to untreated group are depicted in light blue. Array data for the shRNAs targeting the 5 hit genes are shown by distinct symbols. (D) Plot of target gene knockdown versus enrichment of shRNAs in FAS-treated samples for hit genes. FAS resistance was measured by relative proliferation rate of cells infected by individual candidate shRNA viruses (targeting FAS, FADD, CASP8, ARID1A, or CBX1) versus cells infected with a mixture of control shRNA viruses. Target gene suppression was measured by FACS (FAS), immunoblotting (FADD, CASP8, and ARID1A), or quantitative PCR (CBX1).
Fig. 2.
Fig. 2.
Screens for essential genes in 12 cancer cell lines. The 45K pool viral library was used to infect 12 cancer cell lines in multiple replicates. Heat maps depict relative abundance of shRNAs, individually or combined by their gene target (red, high; blue, low). (A) Unsupervised hierarchical clustering of the hhb array data for 175 samples from screens of 12 cell lines (10 replicates per cell line for 4-week time points; 5 or 10 replicates for earlier time points, as noted), and the initial 45k shRNA DNA plasmid pool (10 replicates). The 10,117 shRNAs with the highest coefficient of variation in signal across all 175 samples (CV >0.30) were included in the clustering analysis. (B) Commonly essential genes. The average of “leading edge” shRNA signals for each of the top-100 commonly essential genes (requiring a minimum of 8 of 12 cell lines to contribute to the essentiality enrichment score) exhibits extensive depletion after 4 weeks. (C) Top cell lineage-specific essential genes for cell lines derived from: (i) 4 non-small-cell lung cancers, (ii) 2 glioblastomas, (iii) 2 small-cell lung cancers, and (iv) 4 leukemias. (D) Identification of cell line-specific essential genes based on relative shRNA depletion in 1 cell line versus the other 11 cell lines. Average signals for leading edge shRNAs for the top-10 specific essential genes for each cell line are displayed. ABL1 and BCR are 1st and 5th best-scoring genes, respectively, in K562 cells.
Fig. 3.
Fig. 3.
Identification of known and putative oncogenes by integrating functional and structural genomics. RNAi RIGER scores for CRKL (A), CDK4 (B), and EGFR (C) in each of the 12 cell lines relative to control and copy number changes in NSCLC tumors (26) at the loci encoding these genes. The number of shRNAs ranked in the leading edge of the RIGER analysis is noted. Two or more shRNAs for each gene were required to be in the RIGER leading edge to obtain a RIGER score for that gene; otherwise the RIGER result is labeled N.S. (no score). Significance of the observed copy number changes based on frequency and magnitude was calculated by using the GISTIC algorithm (41). False-discovery rates (red line, −LOG10 Q values for amplification; blue line, −LOG10 Q values for deletion; green line is 0.25 cutoff for significance) are depicted vertically along each chromosomal position.
Fig. 4.
Fig. 4.
Screen for modifiers of the response to imatinib in K562 cells. K562 cells were infected with the 45k pool shRNA viral library and treated in the presence or absence of imatinib for 21 days (10 replicate infections for each group). (A) Averaged microarray hybridization signals for each shRNA in the imatinib-treated cell samples are plotted versus average hybridization signals for the untreated samples. The 400 shRNAs yielding the greatest resistance to imatinib are indicated in light blue. The shRNAs targeting 4 hit genes are labeled. (B–D) Knockdown validation of shRNAs conferring resistance to imatinib. The enrichment of shRNA-infected cells in response to imatinib was tested by coculturing GFP-labeled shRNA-infected cells with control cells for 3 weeks, followed by FACS analysis. Target gene knockdown by the shRNAs was determined by immunoblotting. (B) Cells infected with shPTPN1 were untreated or treated with imatinib, followed by immunoblotting for PTPN1, phosphotyrosine, ABL1 and β-actin. (C) Cells infected with shNF1 were treated with imatinib, followed by immunoprecipitation of GTP-bound RAS and immunoblotting for RAS. (D) Knockdown validation of shRNAs targeting SMARCB1 and SMARCE1.

References

    1. Schlabach MR, et al. Cancer proliferation gene discovery through functional genomics. Science. 2008;319:620–624. - PMC - PubMed
    1. Silva JM, et al. Profiling essential genes in human mammary cells by multiplex RNAi screening. Science. 2008;319:617–620. - PMC - PubMed
    1. Brummelkamp TR, et al. An shRNA barcode screen provides insight into cancer cell vulnerability to MDM2 inhibitors. Nat Chem Biol. 2006;2:202–206. - PubMed
    1. Berns K, et al. A large-scale RNAi screen in human cells identifies new components of the p53 pathway. Nature. 2004;428:431–437. - PubMed
    1. Berns K, et al. A functional genetic approach identifies the PI3K pathway as a major determinant of trastuzumab resistance in breast cancer. Cancer Cell. 2007;12:395–402. - PubMed

Publication types