. 2008 Dec 17;28(51):13716-26.
doi: 10.1523/JNEUROSCI.2940-08.2008.

Region-specific spike-frequency acceleration in layer 5 pyramidal neurons mediated by Kv1 subunits

Affiliations

Region-specific spike-frequency acceleration in layer 5 pyramidal neurons mediated by Kv1 subunits

Mark N Miller et al. J Neurosci. .

Abstract

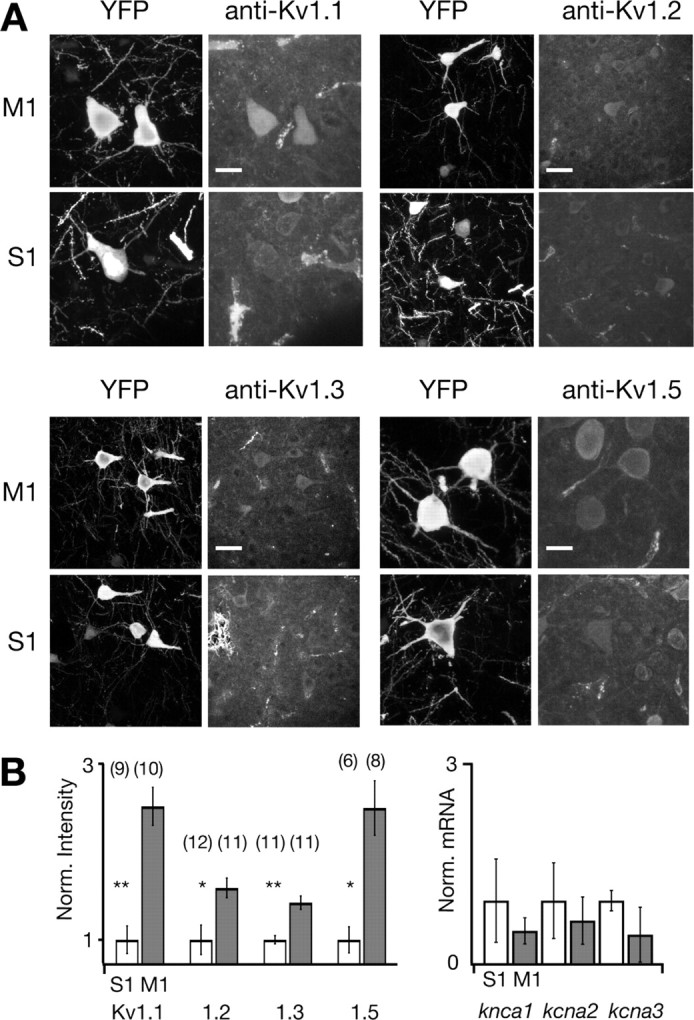
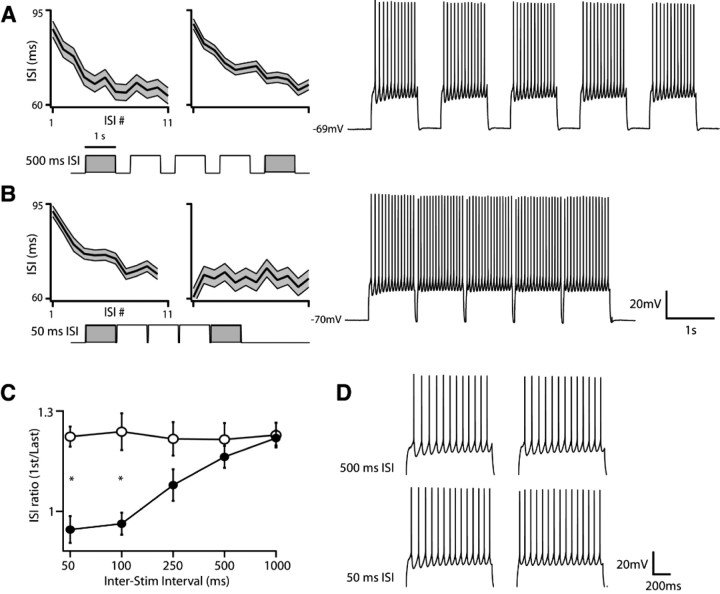
Separation of the cortical sheet into functionally distinct regions is a hallmark of neocortical organization. Cortical circuit function emerges from afferent and efferent connectivity, local connectivity within the cortical microcircuit, and the intrinsic membrane properties of neurons that comprise the circuit. While localization of functions to particular cortical areas can be partially accounted for by regional differences in both long range and local connectivity, it is unknown whether the intrinsic membrane properties of cortical cell types differ between cortical regions. Here we report the first example of a region-specific firing type in layer 5 pyramidal neurons, and show that the intrinsic membrane and integrative properties of a discrete subtype of layer 5 pyramidal neurons differ between primary motor and somatosensory cortices due to region- and cell-type-specific Kv1 subunit expression.


Figures

Figure 1.
Figure 1.
YFPH cells project through the pyramidal tract (PT). Fluorescent microspheres deposited in the pyramidal tract (top) are retrogradely transported to the somata of YFP-expressing layer 5 pyramidal cells (middle). Within the area most densely labeled by microspheres, 42.9 ± 9% of YFP cells (n = 92) and 53.6 ± 11% of retrogradely labeled cells (n = 87) are double labeled (n = 4 FOV from 2 animals). The laminar distributions in both M1 and S1 of retrogradely labeled and YFP cells overlap, are largely confined to layer 5b, and are not statistically different (bottom). Scale bars indicate 1 mm (top) and 25 μm (middle).
Figure 2.
Figure 2.
The intrinsic membrane properties and firing types of PT-projecting layer 5 pyramidal cells are regionally distinct. A, Whereas PT-projecting cells in S1 produce nonadapting trains of action potentials in response to current injection, their counterparts in M1 exhibit a delayed first spike and subsequent spike-frequency acceleration. Subthreshold current injection produces a depolarizing voltage ramp in M1 but not S1. B, Population interspike interval (ISI) curves from M1 (dark gray, n = 39) and S1 (light gray, n = 16). The ratio of the second to last ISI, a measure of spike-frequency adaptation, is statistically different between regions (p < 0.01). Envelopes indicate SEM. C, Somal locations of reconstructed accelerating (dark circles) and nonadapting cells (light circles) with respect to cortical regional boundaries. Accelerating cells are found exclusively in M1 and on the M1/M2 border.
Figure 3.
Figure 3.
A DTX-sensitive slowly inactivating outward current is present in M1 but not S1. Bath application of 50 nm DTX-I blocks a slowly inactivating outward current similar to I D in M1 but not S1. A, Whole-cell current traces elicited by the voltage commands in B, before and after application of 50 nm DTX-I. C, Slowly inactivating DTX-sensitive current obtained from M1 (n = 9) and S1 (n = 5) YFPH/PT cells. The current contains both a transient and a slow component, and inactivates with time constants of 33 ms (transient) and 970 ms (slow) at −30 mV. D, Population IV curve for the DTX-sensitive current obtained from M1 cells. Note that the current activates at membrane voltages positive to −55 mV. Error bars here and in other figures indicate SEM unless otherwise noted.
Figure 4.
Figure 4.
Spike-frequency acceleration is DTX sensitive. Application of 100 nm DTX-I profoundly and significantly (p < 0.01, n = 8) attenuates spike-frequency acceleration in M1 PT-projecting cells. A, Voltage traces elicited by 380 pA current injection in the absence and presence of 100 nm DTX-I (leftmost and rightmost traces), and by a 280 pA injection in DTX that evokes a firing rate equivalent to the 380 pA injection in ACSF. B, Population ISI curves ACSF (dark gray) and DTX (light gray). C, Effects of DTX on ISI ratio, rheobase, and action potential voltage threshold. DTX abolished acceleration and increased excitability. D, The relationship between ISI ratio and firing rate before and after DTX application, indicating that the effect of DTX on acceleration occurs at all firing rates tested.
Figure 5.
Figure 5.
MTX- and TiTX-sensitive currents contribute to distinct features of M1 cells' firing type. A, MTX (10 nm)- and TiTX (25 nm)- sensitive currents in M1 PT-projecting cells. Whole-cell current was measured in voltage clamp by stepping to holding potentials between −70 and −30 mV from −80 mV, and the drug-sensitive currents were obtained by subtraction. The MTX-sensitive current includes a transient component that decays rapidly, with no further inactivation, whereas the TiTX-sensitive current decays slowly. B, Population IV curves for the MTX-sensitive current (left, n = 9) and TiTX-sensitive current (right, n = 10). Error bars indicate SEM. C, MTX but not TiTX significantly (p < 0.01) decreases the latency to first spike (top graph), whereas TiTX but not MTX significantly (p < 0.01) attenuates spike-frequency acceleration (bottom graph). Error bars indicate SEM.
Figure 6.
Figure 6.
Regional cell-type-specific differences in Kv1 subunit expression parallel differences in firing type. M1 YFPH/PT pyramidal cells express significantly more Kv1 protein than their counterparts in S1. A, Confocal z-projections of YFPH layer 5 pyramidal cells (left columns) and Kv1 immunocytochemistry (ICC, right columns) in the same field of view (FOV). Scale bars: 15 μm for Kv1.1 and Kv1.5, and 25 μm for Kv1.2 and Kv1.3. B, Expression of Kv1.1, Kv1.2, Kv1.3, and Kv1.5 in M1 and S1 YFPH pyramidal cells. Subunit expression was quantified (left graph) by averaging the Kv1 immunosignal subsumed by YFP-labeled somata throughout the imaged volume and normalizing to S1 expression. Expression of all three subunits is significantly higher in M1 than in S1 (p < 0.001 for Kv1.1 and Kv1.3, and p < 0.01 for Kv1.2 and Kv1.5). Sample sizes for each condition are above each bar. qPCR quantification (right graph) of kcna1, kcna2, and kcna3 mRNA harvested from three samples of 60–80 acutely dissociated YFPH cells from M1 and S1 reveals no significant regional differences, suggesting that region-specific Kv1 subunit expression is regulated posttranscriptionally. Bars represent average expression normalized to the S1 expression of each transcript.
Figure 7.
Figure 7.
I D inactivation kinetics confer a form of intrinsic short-term memory on M1 PT-projecting layer 5 pyramidal cells. The presence and inactivation kinetics of a DTX-sensitive current in M1 PT-projecting cells renders their firing type sensitive to recent depolarization. Stimuli preceded by hyperpolarized epochs elicit accelerating spike trains whereas stimuli that arrive within 250 ms of a depolarizing stimulus elicit nonadapting spike trains. A, Interspike-interval (ISI) curves (left) computed from the first and fifth epochs of 1 s stimuli delivered 500 ms apart, and an example spike train (right) generated by the same stimulus. Note that cells discharge accelerating spike trains for both the first and last stimuli. B, ISI curves and a spike train acquired from the same cells as in A but with stimuli separated by 50 ms. Note that although the first stimulus elicits an accelerating spike train, the response to the fifth stimulus is nonadapting, and that the membrane potential returns to −70 mV between stimuli. C, Adaptation (expressed as the ratio of the second to last ISI) as a function of interstimulus interval. Open circles indicate the ISI ratio in response to the first stimulus and closed circles indicate responses to the fifth. Differences in spike-frequency acceleration between the first and last stimuli are statistically significant (p < 0.01, n = 5) at interstimulus intervals shorter than 250 ms, indicating that the firing type of PT-projecting pyramidal cells in M1 is highly sensitive to recent activity. D, Spiking responses to individual first and last stimuli at 500 ms (top) and 50 ms (bottom) ISI at an expanded time scale.

Similar articles

Cited by

References

    1. Adamson CL, Reid MA, Mo ZL, Bowne-English J, Davis RL. Firing features and potassium channel content of murine spiral ganglion neurons vary with cochlear location. J Comp Neurol. 2002;447:331–350. - PubMed
    1. Bekele-Arcuri Z, Matos MF, Manganas L, Strassle BW, Monaghan MM, Rhodes KJ, Trimmer JS. Generation and characterization of subtype-specific monoclonal antibodies to K+ channel alpha- and beta-subunit polypeptides. Neuropharmacology. 1996;35:851–865. - PubMed
    1. Bekkers JM, Delaney AJ. Modulation of excitability by alpha-dendrotoxin-sensitive potassium channels in neocortical pyramidal neurons. J Neurosci. 2001;21:6553–6560. - PMC - PubMed
    1. Benavides-Piccione R, Ballesteros-Yáñez I, DeFelipe J, Yuste R. Cortical area and species differences in dendritic spine morphology. J Neurocytol. 2002;31:337–346. - PubMed
    1. Bevan MD, Wilson CJ. Mechanisms underlying spontaneous oscillation and rhythmic firing in rat subthalamic neurons. J Neurosci. 1999;19:7617–7628. - PMC - PubMed

Publication types

MeSH terms

LinkOut - more resources