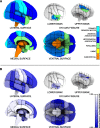
Regional variation in interhemispheric coordination of intrinsic hemodynamic fluctuations
- PMID: 19091966
- PMCID: PMC4113425
- DOI: 10.1523/JNEUROSCI.4544-08.2008
Regional variation in interhemispheric coordination of intrinsic hemodynamic fluctuations
Abstract
Electrophysiological studies have long demonstrated a high degree of correlated activity between the left and right hemispheres, however little is known about regional variation in this interhemispheric coordination. Whereas cognitive models and neuroanatomical evidence suggest differences in coordination across primary sensory-motor cortices versus higher-order association areas, these have not been characterized. Here, we used resting-state functional magnetic resonance imaging data acquired from 62 healthy volunteers to examine interregional correlation in spontaneous low-frequency hemodynamic fluctuations. Using a probabilistic atlas, we correlated probability-weighted time series from 112 regions comprising the entire cerebrum. We then examined regional variation in correlated activity between homotopic regions, contrasting primary sensory-motor cortices, unimodal association areas, and heteromodal association areas. Consistent with previous studies, robustly correlated spontaneous activity was noted between all homotopic regions, which was significantly higher than that between nonhomotopic (heterotopic and intrahemispheric) regions. We further demonstrated substantial regional variation in homotopic interhemispheric correlations that was highly consistent across subjects. Specifically, there was a gradient of interhemispheric correlation, with highest correlations across primary sensory-motor cortices (0.758, SD=0.152), significantly lower correlations across unimodal association areas (0.597, SD=0.230) and still lower correlations across heteromodal association areas (0.517, SD=0.226). These results demonstrate functional differences in interhemispheric coordination related to the brain's hierarchical subdivisions. Synchrony across primary cortices may reflect networks engaged in bilateral sensory integration and motor coordination, whereas lower coordination across heteromodal association areas is consistent with functional lateralization of these regions. This novel method of examining interhemispheric coordination may yield insights regarding diverse disease processes as well as healthy development.
Figures


Similar articles
-
Low frequency fluctuations reveal integrated and segregated processing among the cerebral hemispheres.Neuroimage. 2011 Jan 1;54(1):517-27. doi: 10.1016/j.neuroimage.2010.05.073. Epub 2010 Jun 4. Neuroimage. 2011. PMID: 20570737 Free PMC article.
-
Increased interhemispheric resting-state functional connectivity after sleep deprivation: a resting-state fMRI study.Brain Imaging Behav. 2016 Sep;10(3):911-9. doi: 10.1007/s11682-015-9490-5. Brain Imaging Behav. 2016. PMID: 26634366
-
Intelligence-related differences in the asymmetry of spontaneous cerebral activity.Hum Brain Mapp. 2015 Sep;36(9):3586-602. doi: 10.1002/hbm.22864. Epub 2015 Jun 8. Hum Brain Mapp. 2015. PMID: 26059228 Free PMC article.
-
Integrated technology for evaluation of brain function and neural plasticity.Phys Med Rehabil Clin N Am. 2004 Feb;15(1):263-306. doi: 10.1016/s1047-9651(03)00124-4. Phys Med Rehabil Clin N Am. 2004. PMID: 15029909 Review.
-
The continuing challenge of understanding and modeling hemodynamic variation in fMRI.Neuroimage. 2012 Aug 15;62(2):1017-23. doi: 10.1016/j.neuroimage.2012.02.015. Epub 2012 Feb 14. Neuroimage. 2012. PMID: 22366081 Free PMC article. Review.
Cited by
-
Local signal time-series during rest used for areal boundary mapping in individual human brains.PLoS One. 2012;7(5):e36496. doi: 10.1371/journal.pone.0036496. Epub 2012 May 4. PLoS One. 2012. PMID: 22574171 Free PMC article.
-
Aberrant interhemispheric functional reciprocities of the default mode network and motor network in subcortical ischemic stroke patients with motor impairment: A longitudinal study.Front Neurol. 2022 Oct 4;13:996621. doi: 10.3389/fneur.2022.996621. eCollection 2022. Front Neurol. 2022. PMID: 36267883 Free PMC article.
-
Dynamic functional connectivity revealed by resting-state functional near-infrared spectroscopy.Biomed Opt Express. 2015 Jun 5;6(7):2337-52. doi: 10.1364/BOE.6.002337. eCollection 2015 Jul 1. Biomed Opt Express. 2015. PMID: 26203365 Free PMC article.
-
Interhemispheric functional connectivity and its relationships with clinical characteristics in major depressive disorder: a resting state fMRI study.PLoS One. 2013;8(3):e60191. doi: 10.1371/journal.pone.0060191. Epub 2013 Mar 29. PLoS One. 2013. PMID: 23555920 Free PMC article.
-
Integrating Structural and Functional Interhemispheric Brain Connectivity of Gait Freezing in Parkinson's Disease.Front Neurol. 2021 Apr 15;12:609866. doi: 10.3389/fneur.2021.609866. eCollection 2021. Front Neurol. 2021. PMID: 33935931 Free PMC article.
References
-
- Aboitiz F, López J, Montiel J. Long distance communication in the human brain: timing constraints for inter-hemispheric synchrony and the origin of brain lateralization. Biol Res. 2003;36:89–99. - PubMed
-
- Aboitiz F, Scheibel AB, Fisher RS, Zaidel E. Fiber composition of the human corpus callosum. Brain Res. 1992;598:143–153. - PubMed
-
- Bartzokis G, Sultzer D, Lu PH, Nuechterlein KH, Mintz J, Cummings JL. Heterogeneous age-related breakdown of white matter structural integrity: implications for cortical “disconnection” in aging and Alzheimer's disease. Neurobiol Aging. 2004;25:843–851. - PubMed
-
- Belger A, Banich MT. Interhemispheric interaction affected by computational complexity. Neuropsychologia. 1992;30:923–929. - PubMed
MeSH terms
Grants and funding
LinkOut - more resources
Full Text Sources
Medical
